
How Much Does it Cost to Make an App? The average cost of developing an app ranges from US $60,000 to $250,000.
If you’ve ever pitched a mobile product idea to a CTO or a CFO, you’ve heard the question already: “It’s just an app. How much could it really cost to make?” Honest answer: building an app runs anywhere from $60,000 to $250,000, and most of that spread depends on choices you make about the project.
As a healthcare app development agency, we can only give you an estimate for a custom web or mobile product. The final price tag comes down to the number and complexity of screens, the platform choice (multiplatform = more effort), ongoing maintenance, and the QA program your app actually needs.
At Topflight, we break the cost to build an app into four buckets:
- Design – branding, animations, UX/UI design, design system foundations
- Technical build – API and platform integrations, business logic, infrastructure, third-party SDK setup
- QA – test plans, manual exploratory testing, automation, regression cycles before release
- Maintenance – server costs, bug fixing, OS upgrades, security patching
Entire books cover this. The breakdown below is the rough order in which app development costs hit a real budget. Use it as a working frame the next time you’re budgeting for app development, or sanity-checking a quote from a vendor.
Top Takeaways:
- Every app is different, and that uniqueness drives the total cost of creating an app up or down. The mobile app development cost breakdown below works as a scoping frame, with real numbers attached only when we know the project.
- The average cost to develop an app that gains real traction and keeps paying users is around $80,000.
- Mobile application development cost climbs fast when you add AI/ML, GPS, IoT integrations, phone sensors, or e-commerce features.
Table of Contents
1. App development cost overview 2026
2. Quick breakdown: app development cost
3. How AI is changing app development costs in 2026
4. Factors that affect app development costs
5. App development cost depending on mobile app complexity
6. How long does app development take?
7. App development process and software costs
9. App development cost depending on type of app you’re building
10. Build vs. buy: is custom app development worth it?
11. App development cost estimation by business categories
12. App development cost depending on complexity of features
- API integrations
- Machine learning
- E-commerce
- Geolocation
- Phone sensors
- IoT integrations
- Accessibility options
13. Cost of adding GenAI (LLMs) to your app
14. App development costs by region
15. App development cost depending on the team
16. Hidden app development costs
17. The “compliance tax” in healthcare app development
18. Optimizing app development costs
19. App development financial planning guide
20. App development cost calculators
21. Future of app development costs 2025–2027
22. How much does it cost to build your app with Topflight?
23. Why Topflight is the cost-smart partner for app development
24. Need to know more about app cost?
App development cost overview 2026
In 2026, app budgets come down to ambition, runway, product complexity, and how aggressively your team uses AI tooling to compress delivery time.
Current market pricing trends
Across recent surveys and agency reports, most 2025 app projects landed somewhere between $10,000 and $500,000+, with the spread driven mainly by complexity, platform coverage, integration depth, and the seniority of the team building it.
Simple apps (few screens, minimal backend) still show up in the $5,000–$50,000 band in many cost guides, while “serious” mobile apps with custom backends, third-party integrations, analytics, and proper QA coverage commonly run $100,000–$500,000+.
If you filter out ultra-basic marketing apps and side projects, most funded teams building a v1 in the US/EU end up in roughly the $80,000–$250,000 window for a mobile app with real workflows. That matches what we typically see in our own pipeline.
Hourly rates softened in 2025 while project scope expanded. Global software developer rates dropped about 9–16% in many regions as AI tools compressed delivery time and competition intensified, but teams kept adding AI features, multi-platform UX, deeper third-party integrations, and richer analytics. So total project budgets aren’t falling as fast as hourly prices.
For most founders, this is a sanity-check on mobile app development pricing. Does your quote roughly line up with these ranges once you factor in complexity, integrations, team location, and the seniority you’re paying for, or is it suspiciously cheap or inflated for what you’re asking a team to build?
Cost ranges by app category
You’ll see different cost bands quoted online. Underneath, most of them collapse into a few practical tiers:
Utility / simple companion apps
Think:
- marketing apps
- simple calculators
- basic internal tools with a light backend
- single-feature consumer or productivity apps
Typical build budgets cluster around $10,000–$60,000, especially when you lean on templates or cross-platform frameworks.
Transactional or “product” apps
Think: consumer apps with login, payments, notifications, dashboards, maybe chat or booking.
Several 2024–2025 guides put medium-complexity apps in the $50,000–$150,000 band, sometimes up to ~$180,000 with richer UX and integrations.
Enterprise / regulated platforms
Think: multi-role apps with heavy backend logic, deep analytics, third-party integrations, and compliance workflows (EHR/EMR, ERP, payment gateways, logistics, etc.).
Here, surveys increasingly cite $150,000–$500,000+ as a realistic range, with many fully custom, feature-rich mobile products averaging in the $100,000–$500,000 band.
The cheap outliers you see in ads (“we’ll build your app for $5k”) almost always assume minimal scope, a template-heavy build, a team in a very low-cost region, no real QA budget, or some combination of those. None of those gets you a durable product you can scale and iterate on.
Regional cost variations
App development cost changes sharply by region, but don’t treat any single price as a universal truth. Offshore studies often publish median rates and a neat regional average, yet the typical spread inside each geography is driven by country and seniority, and by whether you’re hiring senior mobile architects, full-stack generalists, iOS or Android specialists, or QA engineers from top agencies in major cities (where overhead is baked into the quote).
In practice, real projects rarely run on a single-region team anymore. Most teams converge on hybrid teams with a blended hourly rate: keep product and architecture leadership close to the business (often US/EU), and scale execution through places like Eastern Europe or LATAM when the work is well-defined. That’s how you get mid-priced quotes that still behave like a senior team, while staying realistic about the new baseline. AI tooling means even cheaper-region teams now charge for faster iteration cycles, so the old “save money by going offshore” math doesn’t carry the same weight anymore.
Quick cost assessment tool
Use this as a 30-second sanity check before you fall in love with anyone’s “from $X” landing page.
If you answer “yes” to a statement, slide your mental budget up a notch:
- “We have 3+ distinct user roles” (e.g., admin, consumer, clinician/provider, and back-office staff).
- “We need secure login, payments, real-time chat or video, and at least one major third-party integration” (Stripe, Twilio, EHR, marketplace APIs, etc.).
- “We expect polished UX with dedicated product and design effort in the budget” (separate from engineering hours).
- “We want a North America or Western Europe lead team for product and architecture” (offshore execution support is fine).
Rough rule of thumb for 2025, based on current market data:
- 0–1 “yes” → $20,000–$60,000 territory
- 2 “yes” → $60,000–$120,000 range
- 3 “yes” → $120,000–$180,000 range
- 4 “yes” → $180,000–$400,000+ for a credible v1, especially in regulated or integration-heavy domains
Cross-check this quick pass against the detailed breakdowns below before you commit to a budget.
Quick breakdown: app development cost
The cost of developing a mobile app depends on the scope of the project, including app complexity, design requirements, integration surface, and post-launch maintenance.
| Development phase | Estimated cost ($) | Description |
|---|---|---|
| Discovery | $4,500 – $8,000 | Mapping audience needs against business goals over 30-40 hours. |
| Prototyping & design | $15,000 – $30,000 | Iterative UX and visual design, refining flow and look across rounds. |
| Development | $35,000 – $75,000 | Coding and integration work, usually 50-70% of total spend. |
| Quality assurance | $8,000 – $18,000 | Manual and automated testing across devices, OS versions, edge cases, and stress scenarios. |
| Deployment | $2,000 – $4,000 | App Store / Play Store submission, backend cutover, release verification, and post-launch monitoring setup. |
| Maintenance | 25% of total app cost per year | Ongoing upkeep for backend systems and integrations. |
| Total average costs | $80,000 – $250,000 | Varies by app scope and features. |
The cost to develop a mobile app typically ranges from $80,000 to $250,000, depending on app complexity, feature set, development approach, and the team you hire.
Cost breakdown methodology
These ranges assume you’re building a real v1/MVP that needs traction in the market. The numbers in the table are based on a typical product team working a few months at a blended rate (design + engineering + QA + PM), with enough room for iteration cycles between sprints.
Think of these as planning brackets for scoping. They show roughly how much budget each phase usually consumes when a team aims for quality across design, dev, QA, and the iteration loops between them.
Why development costs vary
Two apps can both be “MVPs” and still sit at opposite ends of the cost spectrum. The biggest levers are:
- scope: how many user roles, flows, edge cases, and exception paths you support
- integration surface: payments, APIs, EHRs, internal systems
- team model: US/EU-led, fully offshore, hybrid, or specialist sub-team
- design polish: branding, visual design, micro-interactions, accessibility
- compliance overhead: HIPAA, SOC 2, GDPR/data residency, BAA chains
How often you plan to iterate after launch matters too. The same idea can be a $60k project or a $250k+ one depending on which levers you’re pulling.
Budget planning best practices
Your working app development budget template starts with outcomes. Anchor your spend to the 1-2 results you need to hit, map those to concrete phases (discovery, design, build, QA, maintenance), and only then decide how far up or down the ranges you’re willing to go.
A simple way to avoid surprises is to anchor your budget to outcomes. Define the 1-2 business goals your v1 must hit (e.g., paying users, pilot metrics), lock a small set of must-have features to support them, and treat everything else as optional. Then add a 10-20% contingency on top of your ideal number for scope creep, refactors, integration delays, and the “unknown unknowns” that always show up.
Cost vs. value analysis
Worth asking: “What are we buying with this spend?” A higher upfront budget might buy you:
- faster time-to-market
- better retention
- fewer rewrites
- smoother fundraising story
A rock-bottom budget often buys you technical debt and a rebuild in 12-18 months. Viewing the table as value tiers (what each level delivers for the business) makes it much easier to decide where to land.
How AI is changing app development costs in 2026
AI is pulling app development cost in 2 directions.
For regular build work, it can cut hours. Routine implementation, QA support, refactoring, documentation, and boilerplate all move faster when the team knows how to use AI without letting it spray junk into the repo. That pressure is already showing up in pricing. Global software developer hourly rates softened by roughly 9-16% in several outsourcing regions, especially Eastern Europe and South Asia.
Nice try, Silicon Valley. That still doesn’t make AI a coupon.
Once AI becomes part of the product, the budget picks up new line items: model API fees, vector databases, prompt engineering, evaluations, fine-tuning, guardrails, security review, observability, and human review workflows. The cheaper parts sit next to new costs that didn’t exist in a normal mobile or web app estimate.
| Cost area | Before AI-assisted development | With AI-assisted development in 2026 |
|---|---|---|
| Routine coding | More manual boilerplate and repetitive implementation work | Faster scaffolding, code suggestions, test generation, and refactoring support |
| Developer hourly rates | Higher pressure on rates due to talent scarcity and post-2021 demand | Softer global rates in some regions, while senior AI-fluent teams still command premium pricing |
| QA and documentation | Manual test writing and slow regression updates | AI can speed up test cases, release notes, edge-case discovery, and documentation drafts |
| AI feature costs | Not applicable unless the app used traditional ML | Model API usage, vector DB, prompt design, evaluations, fine-tuning, guardrails, security review, observability, and human review |
| Total project budget | Mostly driven by people, scope, platforms, integrations, and compliance requirements | Spend moves from commodity work toward AI architecture, data quality, usage-based operations, and production oversight |
For a standard app, AI can compress delivery time when the team knows which work to automate and which work still needs a human. CRUD screens, test scaffolds, release notes, and boilerplate are fair game. Product judgment, architecture, risk review, and weird edge cases still need people who know what they’re looking at.
For an AI app, the estimate needs a different shape. You’re paying for screens and backend logic, plus model behavior, data pipelines, safety checks, usage economics, and the human review loop that keeps the feature from doing something expensive in production.
That’s why “AI app development cost” needs its own estimate. A simple AI-assisted feature may add a few thousand dollars. A production-grade AI workflow with retrieval, evaluations, compliance controls, monitoring, and human review can push the budget into a much higher tier.
Factors that affect app development costs
Many factors influence app development costs, including development process, type of application, availability of reusable off-the-shelf components, developers’ experience, and app complexity.
| Factor | Description | Price impact |
| Discovery step | Match audience needs and business goals in the 30-40 hour discovery stage; pick the development approach that fits the cost and time budget. | $4,500 |
| Prototyping & design | Iterative work on user experience and visual design, including user testing rounds. | $15,000-$30,000 |
| Coding/development | App development is 50-70% of total spend, with the range driven by app type, existing codebase, backend needs, and how far you want it to scale. | $35,000-$75,000 |
| QA testing | QA includes unit and system testing across multiple devices and OS versions, plus regression runs before any release. | $8,000-$18,000 |
| Deployment | Final app verification, store submission, and backend cutover at release. | $2,000 |
| Maintenance | Cloud-based backends and third-party integrations need ongoing maintenance work. | 25 percent of total app cost per year |
| Cross-platform approach | Native apps give you full hardware access and the best performance; cross-platform frameworks cut cost when the use case fits. | up to 40-50 percent cheaper than native |
| PWA | PWAs deliver cross-platform reach at a lower cost, with limited hardware integration as the trade-off. | 30 percent of the native app cost |
| API integrations | API integrations let mobile apps work with external services. | $1,000-$6,000 per integration |
| AI/ML | Machine learning personalizes app content but raises development costs. | high impact |
| E-commerce | Ready-made e-commerce platforms keep the mobile shopping build cheaper than going custom. | varies |
| Geolocation | Geolocation integration varies in cost; using native SDKs is cheapest. | $4,000-$8,000 |
| Using phone sensors | Phone sensors enable advanced features, and the API work adds to development costs. | $2,100 per sensor |
| IoT integrations | Apps that pull data from external IoT devices add real cost. | $9,000 per integration |
| Accessibility features | Accessibility options matter for inclusiveness, and they’re rarely free to retrofit. | $15,000-$25,000 |
All numbers above assume you’re developing an MVP (minimum viable product), the first shippable version of your product. They cover the main factors behind an app’s price.
Technical complexity impact on cost
The fastest way to blow past your initial estimate is to underestimate technical complexity. The items in the table that look like “just another feature” (AI/ML, IoT integrations, accessibility, multi-role workflows) often behave like mini-projects inside your project. Each one typically increases:
- Architecture overhead – more moving parts in the backend, additional data flows, sync logic, and failure modes to design around.
- QA depth – extra test scenarios, more devices to cover, additional edge cases, and longer regression cycles.
- Compliance/security work – especially once you touch payments, health data, sensitive PII, or audit-trail requirements.
- Operations and monitoring – more services to instrument, additional alerts to tune, dashboards to keep current, and on-call playbooks to maintain.
This is why two apps with the same UI can sit in entirely different budget brackets.
Timeline pressure and rush charges
How fast you insist on shipping changes the cost as much as what you build. Compressing a 6-month roadmap into 3-4 months usually means:
- Running more people in parallel (which adds coordination overhead).
- Making trade-offs: technical debt now, refactors and rewrites later.
- Paying a premium for senior people who can unblock problems quickly.
- Cutting QA scope or pushing certain test layers to after launch.
You can absolutely buy speed, but it rarely comes for free. The bill just shows up either as a higher initial quote or as more expensive cleanup work after launch.
Post-launch cost considerations
The table already hints at this with maintenance ≈ 25% of initial build per year, and that’s before ambitious roadmap changes. Ongoing costs typically cluster into:
- Run costs – cloud, databases, monitoring, 3rd-party SaaS/SDK fees.
- Care and feeding – bug fixes, OS/device updates, security patches, dependency upgrades.
- Growth work – new features, A/B experiments, refactors, and instrumentation improvements as you learn from users.
- Compliance refresh – BAA renewals, security audits, policy updates, third-party vendor assessments.
If you budget only for the build, every surprise during the first 12-18 months of life after launch will feel like “overrun.” With post-launch costs already baked in, the same surprises read as the normal cost of owning a product.
Hidden cost factors to consider
A lot of founders account for “dev hours” and forget the quiet multipliers that show up later. In practice, you also pay for:
- Product and project management time – both on the vendor side and in your own team.
- Back-office work – analytics setup, logging, alerting, basic reporting.
- Go-to-market plumbing – app store assets, marketing sites, CRM hooks, support workflows.
- Legal and contracts review – BAAs, DPAs, vendor security questionnaires, IP assignment paperwork.
This is your early reminder to keep some budget oxygen for the hidden app development costs that never fit neatly into a features list.
App development cost depending on mobile app complexity
Mobile app development costs vary significantly based on app complexity.
Tier 1: Simple mobile app ($30,000 to $40,000)
Basic UI, light backend, simple navigation, no third-party integrations beyond the obvious. User registration, simple forms, minimal backend support, and basic flows are about as far as you go. Think calculators, plain to-do lists, single-feature consumer apps, or marketing apps that mostly point users at content.
Tier 2: Mid-size mobile app ($40,000 to $60,000)
Where most v1 builds actually land. Fitness trackers, basic e-commerce, event management, booking apps. Moderate backend development, basic third-party integrations, user authentication, and real data handling. The jump from simple is the moment your backend has to remember things across sessions and survive concurrent users.
Tier 3: Large-size mobile app ($80,000 to $140,000)
Real-time features, multi-tenant data, deeper backend logic, three or four integrations that all have to stay reliable at the same time. Social platforms, full-featured e-commerce, telemedicine apps with HIPAA scope, multi-tenant SaaS dashboards. The cost jump here comes from the QA matrix: every integration has its own failure modes, and they multiply.
Tier 4: Complex mobile app ($160,000 to $210,000)
Now you’re in mini-project-inside-the-project territory. AI/ML pipelines, IoT device connections, deep security work, complex business logic that doesn’t fit on one whiteboard. Healthcare management systems, fintech with serious financial operations, highly interactive gaming, AI-powered enterprise tooling. Each non-trivial subsystem brings its own architecture decisions, QA depth, compliance review, and on-call playbook.
Tier 5: Enterprise-level mobile app – starts from $250,000
Enterprise builds answer to a different reality. The procurement cycle alone often outlasts your initial estimate. High scale, hardened security, durable backend infrastructure, full enterprise integrations (EHR, ERP, CRM, identity providers), and a QA program that has to clear regulatory and uptime bars before launch.
Hospital management systems, enterprise communication tools, large-scale fintech platforms, multi-region SaaS deployments. Custom-designed interfaces are the norm. The $250k floor assumes discovery is done; the ceiling is wherever stakeholders stop saying yes.
Typical examples include hospital management systems, enterprise communication tools, large-scale fintech platforms, and multi-region SaaS deployments.
How long does app development take?
Most credible v1 app builds land somewhere between 3 and 9 months. The calendar stretches when the product needs more user roles, more integrations, more compliance checkpoints, or more ways for users to break the happy path.
A simple app can launch in a few months. A regulated platform with payments, analytics, integration work, and real QA coverage can run 9-12+ months without anyone doing anything wrong. That’s just the size of the build.
| App complexity | Typical timeline | What usually drives the schedule |
|---|---|---|
| Simple app | 2-3 months | Basic screens, light backend, simple login, minimal integrations |
| Mid-size MVP | 3-5 months | Authentication, payments, dashboards, notifications, basic admin tools |
| Large product app | 5-8 months | Multiple roles, custom backend logic, analytics, 3rd-party integrations, deeper QA |
| Complex app | 8-12 months | AI/ML, IoT, real-time features, compliance workflows, advanced security, heavy integration work |
| Enterprise platform | 12+ months | Procurement, stakeholder approvals, EHR/ERP/CRM integrations, audit requirements, scale testing |
Scope discipline shortens an app development timeline faster than adding more developers. Past a certain point, extra people add coordination overhead. That’s the part of software development where everyone gets very busy explaining why nothing is moving faster.
Cut scope vertically instead. Ship the smallest useful version of the highest-value workflow, put it in front of real users, then expand once the core behavior holds up.
A healthcare startup might launch a web-first clinician workflow before building iOS and Android apps. A marketplace might start with 1 geography and 1 transaction type before adding subscriptions and enterprise reporting.
As a planning rule, discovery and design usually take the first 4-8 weeks. Development takes the largest block of time. QA and deployment need their own room in the schedule, especially when the app has integrations, compliance requirements, multiple user roles, or audit trails.
When a quote shows a complex app launching in 8 weeks, read the fine print. The scope is probably tiny. Or QA has been quietly thrown overboard.
App development process and software costs
Start building an application and you’ll find yourself following a procedure from the 90s. These app development stages still apply, and each one shapes the cost to develop a mobile app.
The mobile app development process breakdown below shows how each stage affects the app cost.
Phase 1: Discovery
During the discovery stage you match the needs of the target audience to app functionality and define business goals.
It may take 30-40 hours from the app development budget to complete such business analysis. Remember that the development approach will significantly affect your development timeline.
For example, agile development takes only a couple of days to draw up a plan for the next sprints, whereas the traditional waterfall approach consumes 10 percent of the entire app cost.
Pro Tip: If you’ve done preliminary market research (including proper research of your target audience), we recommend limiting the budget of the discovery step to 30-40 hours / $4,500. Invite business analysts familiar with your domain to sail through this step faster. Then move on to the design stage
Keeping discovery lean
Tactical ways to keep the discovery phase lean:
- Do your homework before paying for ours. Come in with a basic problem statement, user personas, competitor list, and a few must-have workflows. The more we’re validating and stress-testing (vs discovering from scratch), the closer you stay to the 30-40 hour range mentioned above.
- Timebox the decisions themselves. Lock a fixed number of sessions and define what must be decided by the end: success metrics, user roles, must-have workflows for v1, budget range. Everything else is backlog material.
- Separate must-haves from “nice origin stories.” Capture interesting ideas, but only tag 3-5 as non-negotiable for v1. The rest go into a parking lot so discovery doesn’t quietly turn into product strategy for the next 3 years.
- Use domain experts surgically. Bring clinicians, ops, compliance folks, or product owners into short, focused interviews rather than full-day workshops. The goal is to capture their constraints and edge cases without turning sessions into committee design exercises.
- Favor cheap artifacts. Prioritize lean deliverables (problem statement, user flows, rough scope, and budget brackets) over glossy decks. The purpose of discovery is to de-risk spend in later phases. Documentation you’ll never read again doesn’t qualify.
Phase 2: Prototyping and design
The next step after the discovery is to think through user experience and create graphical assets. To determine the cost to design an app, we proceed by creating a clickable prototype.

More than pretty colors
Design of an app is more than the color scheme, icons, logos, or animation for screen transitions. For the overall design of an application, we consider the aesthetics of a finished product: user interface and user experience.
Ultimately, it’s the design and development team’s job to make sure no user gets lost or confused. As with features, design choices range from simple to complex, which impacts the budget to make an app.
In a simple case, you develop an app using a lightly-customized bootstrap theme.
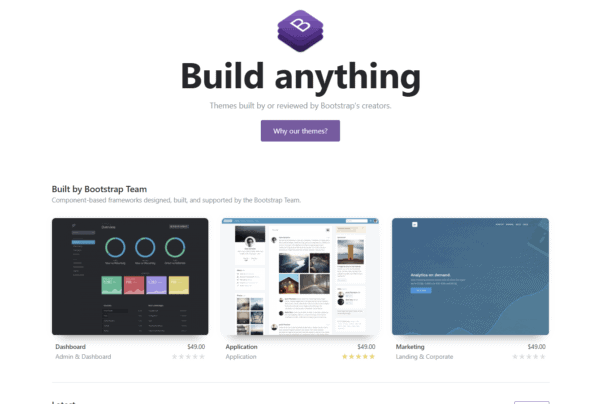
Image credit: Bootstrap
In more complex cases, the app design cost will be higher for clients: custom multi-screen software built from scratch, with complex navigation, platform-specific UX behavior, durable back-end logic, and tight integration with multiple systems. Assessing all that is critical to determining the time and money required to deliver the app project.
Picture an Uber-like app with few screens but heavy customization, then compare it to an enterprise app with minimal design requirements.
Read more on enterprise mobile app development
Each step of the design process must lead to a clean, easy-to-use UI to keep the user engaged. That takes a lot of back-and-forth and will affect development pricing.
Wireframes, interfaces, prototypes, and testing, oh my!
Our design process starts with a schematic of how a user works with the software: a “user journey”. This is where we get a sense of the scope of the design work (takes 6-9 hours).
Next, we create wireframes for the app based on the user journey: no frills, programmer art instead of design assets. We sketch out where the buttons, fields, text, and navigation will sit.
The wireframing stage takes half the design process: 40-50 hours.
After this scaffolding work we start working on the actual design: consider the color choices, animations, fonts, and the overall style of the app, its brand image.
Prototyping and designing an application take the bulk of the front-end time, around 50 hours each. After the design, we’re looking at 80 to 120 hours of front-end work from start to finish (this cost estimate accounts for a first-pass attempt).
User testing
When determining the cost to create an app, founders often forget about a prototype, which should always go through a user-testing process (using a service like usabilityhub).
Usually, user testing leads to design revisions and more testing: we rinse and repeat until we get it right (changes in code are more expensive).
Even a perfect backend won’t save you if the design feels like a gimmick.
Pro Tip: Iterating on design is 80 percent cheaper than iterating on code; put in the extra time here to maximize ROI. The cost of the prototyping and design phase of app development takes $15,000 to $30,000.
Related: Custom Mobile App Development: The Complete Guide
Design phase investment strategies
Here’s how to invest without gold-plating everything:
- Spend design hours where they matter most. Put your best UX/UI energy into the 2-3 flows tied to revenue or clinical outcomes (onboarding, booking, key task path, and primary search). Low-traffic settings pages can use a clean but generic pattern.
- Build a small design system early. A minimal set of reusable components (buttons, inputs, cards, typography scale) saves both design and front-end dev hours over the life of the project. Think of it as designing a kit that produces all your screens consistently and saves rework later.
- Reuse where users don’t care. Native platform patterns or off-the-shelf UI kits are fine for standard flows (login, profile, settings, list/detail views). Save bespoke visuals for places where you need differentiation.
- Cap revisions with clear decision-makers. Endless iteration is the silent budget killer. Set explicit limits on design rounds per screen set, and appoint a single product owner who can say “this is good enough for v1.”
- Prototype to kill bad ideas early. A clickable prototype and a handful of usability tests can save dozens of dev hours later. Any design idea that can’t survive basic user testing probably shouldn’t survive into the backlog.
Phase 3: Development
App development per se impacts the app cost the most. Seasoned developers are still a scarce resource. That’s why coding an app accounts for 50-70 percent of the total costs of app development. Coding times vary by app type: from chatbot app development to building a marketplace app, a trading and investment app, developing a healthcare app, or creating a crypto token.
All of which means the software application development cost is a serious investment, with the specific app type and required expertise driving most of the variance.
Also Read: How to Build Your Fintech Startup
Built from scratch vs. existing projects
Whether an application is built from scratch or uses an existing codebase also affects mobile app development costs.
Existing projects naturally bear the marks of their original creators.

Sometimes code is poorly written; simply not what our devs are used to. It’s common to hear a client saying the previous developer did 80 percent of the work when the reality is 30 percent.
Plus, because an existing project requires a billable discovery phase, it’s imperative to communicate amicably with the outgoing developers. Without documentation or knowledge of existing issues, discovery eats more of the project’s billable hours, increasing the cost to develop an iPhone app.
Backend code
Whether an application is for scheduling patient appointments or babysitting hours, finding specialized recipes, tracking disease symptoms, or merely displaying a blog, it usually needs some kind of backend: a database, a payment processor, a content management system, or an authentication layer. Unless your app offers very basic features, it must have a backend system.

The most popular SaaS backends provide off-the-shelf solutions that simplify writing parts of an application. Shopify software development kit (SDK) is a typical example: store owners can create iOS and Android apps that use the functionality typical for an ecommerce store: cart, discounts, payments, inventory, and shipping logic. Such SDKs significantly reduce the iPhone or Android app development cost.
Often another developer has already written tools to solve 75 percent of the problems you need to solve. Open-source software like FuturePress, a javascript library to render Epub files, is a huge boon for the cost-conscious app developer.
Packaged components like these drastically reduce the development time for the core of a mobile/web solution.
Scaling and customization overhead
Simplicity can end up hamstringing how far your app can scale. WordPress, for example, is a fantastic solution for slowly changing sites with mostly static content like blogs. But it struggles with high-traffic content like an extensive product catalog with searches and filters, serving thousands of customers.
Beyond scaling issues, customization of off-the-shelf components can have an even higher overhead for developers than writing from scratch. Changing another dev’s codebase is not a trivial task.
Development time (and thus average cost of app development) depends largely on the feature-set and the availability and feasibility of open-source software and SaaS platforms.

If you’re building a vanilla offline application, then chances are there are feasible pre-existing solutions, and it’ll be fairly affordable to build.
But if your business model implies building something completely new and original, that’ll cost a pretty penny.
Pro Tip: coding takes 50-70 percent of all app costs. So expect to budget for $35,000-$75,000 for the coding stage of your app development.
Also Read: No code/Low code app development processes
Development phase budget management
Ways to keep the coding phase financially sane:
- Slice features vertically across the stack. Ship thin end-to-end slices (API + UI + basic tests + analytics hooks) per feature, rather than building the entire backend, then the entire frontend. You’ll catch wrong assumptions earlier and avoid rewriting large chunks of code.
- Be ruthless about scope per sprint. Every sprint should clearly state what must ship to move a business metric. If a story can’t be tied to a user or revenue outcome, it probably doesn’t belong in the current cycle.
- Use “custom” only where it pays off. Admin panels, reporting, internal dashboards, and basic user management often don’t need full custom builds. Off-the-shelf tools or low-code back-office apps can absorb a lot of non-differentiating functionality.
- Standardize your stack. A narrow, battle-tested stack (e.g., React/React Native, one backend framework, a known cloud provider, and a single CI/CD platform) keeps hiring, debugging, maintenance, and onboarding costs down. Exotic tech choices tend to show up later as expensive edge cases.
- Track cost per feature, plus per sprint. Tag stories with feature/epic labels and review their total hours regularly. When you see a “simple” feature quietly pass the 80-100 hour mark, you can still decide to cut or simplify before the sunk-cost fallacy kicks in.
Think of development as controlled spend against a roadmap of bets. The discipline is saying “no” or “not now” often enough to keep the app shippable.
Phase 4: QA testing
A product riddled with bugs or an outdated application that becomes obsolete upon a new operating system release is a big no-no. This brings us to a vital, often overlooked step in the app development process: quality assurance.
QA (aka “testing”) is carried out at Topflight in two ways:
- Unit testing
- System testing
Unit testing deals with each new component added to software individually. And system testing deals with overall performance and usability.

We do unit testing as we build the app, using peer-to-peer coding. System testing starts when the app’s development is complete.
QA assures both the client and us that the application functions as intended. The Android or iPhone app development cost will depend on the number of tests. We always include regression tests to test against previously fixed issues.
Software updates, operating system upgrades, hardware improvements, and shifting privacy rules all mean that smartphone apps must adapt over time. So the cost to build an application will always depend on required QA activities.
Pro Tip: QA usually takes around 15-20 percent of the total app price tag, in the range of $8,000-$18,000.
Testing phase cost control
Testing means testing the right things, systematically. Cost-control levers in QA:
- Shift testing as far left as possible. Developers writing unit tests and basic integration tests as they go is cheaper than discovering issues only in full-system QA. QA’s job is validating behavior at the app level, with the assumption that the basics already work.
- Automate the golden paths first. Start with automated tests around the revenue- or safety-critical flows (signup, checkout, clinical entry, payment confirmation, and primary search). You get maximum payback for each test case and reduce the manual regression load.
- Right-size your device matrix. You don’t need to test every build on every obscure device. Define a core matrix (e.g., top OS versions and a handful of popular devices) and expand only when analytics show meaningful usage on outliers.
- Timebox exploratory testing. Free-form exploration finds real issues but can expand infinitely. Allocate explicit windows for exploratory QA around new features, then move findings into structured test cases or backlog items.
- Bundle non-critical fixes. Not every cosmetic bug deserves an immediate hotfix. Group low-priority issues into periodic maintenance releases so you’re not paying full overhead for each tiny patch.
Phase 5: Deployment
Fortunately, this stage takes only a fraction of time compared to other phases of making an app. That’s why it’s often overlooked in the roadmap.
At Topflight, we take care of Apple’s and/or Google’s verification process and that the back end has been transferred to a tested production environment.
Pro Tip: allow for up to $1,800 of your app-building cost for the deployment step.
Deployment and launch expenses
Deployment is short, but it’s not free, especially if you want a launch that doesn’t take down your backend or get blocked by an app store rule you forgot existed.
Typical cost drivers and how to tame them:
- App store and release engineering. Account for the work to set up CI/CD, build pipelines, signing certificates, profiles, and separate staging/production environments. Automating this once is cheaper than hand-rolling every release.
- Compliance and policy checks. If you’re handling payments, health data, content, or user-generated media, you’ll need extra review time to make sure you’re not violating App Store / Play Store policies or regulatory basics. It’s cheaper to catch this pre-submission than to fight a rejection.
- Launch assets and tracking. Screenshots, promo copy, privacy labels, and basic analytics/attribution wiring all cost time. Reuse brand assets from your marketing site where possible and define a minimal viable analytics setup for v1.
- Soft launch vs big bang. A staggered rollout (limited geo or invite-only) lets you validate stability and performance before you push traffic. It’s a small upfront cost in planning that often saves you from emergency firefighting.
- Feature flags and rollback paths. Implementing basic toggles for risky features and a clear rollback plan keeps “launch issues” from turning into week-long incidents. That’s budget better spent on roadmap work.
Treat deployment as the last mile of engineering. A clean launch is itself a cost-saving measure.
App maintenance costs
Most apps have back ends on cloud service providers like AWS, Google Cloud, Azure, or DigitalOcean, which can cost pennies or thousands of dollars each month. Connected third-party services (payment systems) use a SaaS model, requiring subscription costs.
As your app’s popularity rises, throughput needs to grow, which racks up app maintenance costs. When you ask “How much does the app cost to develop?”, you also have to factor in these variable maintenance costs that can impact the total investment over time.
Bugs also crop up and need addressing continually.
Pro Tip: We typically estimate the cost for ongoing maintenance around 25 percent of the original development cost per year.
Maintenance cost planning
Most teams remember to budget for “maintenance” and then treat it like a black box. You’ll get better control if you treat it as a structured, recurring investment with predictable cycles.
A practical way to plan:
- Start with a percentage, then break it down. As mentioned above, budgeting around 25% of the initial build per year is a good baseline. Split that into rough buckets: run costs (cloud + SaaS), stability (bug fixes, OS/SDK updates, security patches, dependency upgrades), roadmap (small enhancements), and compliance refresh (BAA renewals, security audits, vendor reviews, policy updates).
- Tie maintenance to real SLAs. Decide what uptime, response time, bug-fix windows, and security-patch turnaround you actually need. A healthcare app with clinical workflows will justify a higher maintenance line item than a simple consumer utility.
- Schedule maintenance windows in advance. Plan quarterly “care and feeding” cycles for dependency updates, security patches, database tuning, and performance work. Planned changes are cheaper than emergency upgrades when something breaks.
- Be explicit about vendor and SDK exposure. Make a list of critical third-party services (auth, messaging, payments, analytics) and their pricing tiers. When any of them is close to a usage threshold, you want to know before the next invoice.
- Protect a small improvement budget. If every dollar goes to keeping the lights on, the product stagnates. Reserve a slice of the maintenance budget for incremental UX improvements, A/B tests, instrumentation updates, and removing old complexity that slows you down.
Good maintenance planning has two payoffs: the app keeps running, and the cost of owning it stays predictable as you scale.
App development cost depending on type of app you’re building
Summary table: App development cost by app type
| App type | Estimated cost | Description |
|---|---|---|
| Native | $100k – $250k+ | Built separately for iOS and Android using Swift for iOS, plus Kotlin or Java for Android. Best performance and full hardware access. |
| Cross-platform | $60k – $180k | Single codebase for multiple platforms (e.g., React Native, Flutter). Great balance of speed and cost. |
| Progressive Web App (PWA) | $30k – $80k | Web apps that work like mobile apps. Cost-effective but limited access to device features. |
| Hybrid | $50k – $120k | Web code (HTML, CSS, JS, plus build tooling) wrapped in a native shell (e.g., Ionic, Cordova). Faster to build, but lower performance. |
| Web | $25k – $100k | Browser-based applications, not installed via app stores. Ideal for desktop or mobile web usage. |
Native vs. cross-platform
Building an app natively, using Swift for iOS and Java or Kotlin for Android, takes more time. In such a case, the solution consists of two codebases: for iOS and Android; plus another one for other platforms (Windows Mobile, anybody?).
That may make native sound like a non-starter, but native codebases have the potential to be more powerful and access all built-in hardware features. Big companies like Uber stay on native tech stacks.
Read the related article: How to Select a Technology Stack
If your app doesn’t need GPS, NFC, Bluetooth, or other hardware-level features, then a cheaper path is open to you: a cross-platform codebase. Many great products (e.g., mobile solutions by Bloomberg or Walmart) chose that path; get in touch for more examples of apps.

Whether to build a cross-platform or native app deserves its own piece. On cost alone, a React Native app tends to take 25-50% less time than two native apps, in exchange for slightly restricted access to advanced hardware features.
Cross-platform codebases have limitations, but the decision to forgo a separate native codebase for individual platforms can mean a shippable product in 4-6 months instead of 12. The average cost of mobile app development backed by cross-platform technologies like Flutter or React Native goes down, accordingly.
Choosing between Android and iOS native development, remember that the price of Android application development will be higher than the price to make an app for the iPhone: way more testing and per-device tuning on Android.
Whichever way you go shapes the mobile apps cost to build more than almost any other decision.
Pro Tip: Cross-platform tools like React Native can trim down app development costs up to 50 percent and allow you to go to market 1.5x faster. Even if you launch on a single platform, say the iPhone, dominating the US smartphone market share, a cross-platform tech stack allows you to reach more platforms in the future.
If you want to learn more, check out our post Swift and React Native comparison.
iOS vs. Android development costs
QA and device coverage
Android’s device/OS fragmentation means more combinations to test and more time spent chasing layout bugs on edge-case devices. iOS tends to be cheaper to stabilize because the hardware and OS matrix is narrower, even though the day rate for an iOS dev might be similar.
Platform implementation and design adaptation
Permissions, navigation patterns, system integrations, and background-task models often need to be wired differently per platform. Notifications, background services, widgets, deep linking, and share extensions each behave differently on iOS versus Android. If you care about platform-native UX, you’ll also spend extra on adapting components (navigation, tabs, menus, typography) to match iOS vs. Material guidelines instead of forcing a one-size-fits-all UI. Real development and design time per platform.
Cross-platform cost savings analysis
Cross-platform is meaningfully cheaper and faster than two natives if your app fits the pattern (no exotic hardware, mostly standard UI).
| Dimension | Two native codebases (iOS + Android) | Cross-platform (React Native / Flutter) |
|---|---|---|
| Build cost | ~$100k–$250k+ for both platforms combined | ~$60k–$180k (often 30–50% cheaper overall) |
| Time-to-market | ~9–12+ months for parity (sequential or semi-parallel builds) | ~4–6 months for both platforms (≈1.5× faster) |
| Codebase & team | 2 codebases, often 2 partially separate teams | 1 shared codebase, 1 core team |
| QA footprint | Separate test cycles per platform, more device coverage on Android | Shared logic tests + smaller platform-specific surface area |
| Maintenance effort | Features built twice; higher long-term dev/QA hours | Single implementation per feature; lower parity and upgrade cost |
| When it shines | Performance-heavy, device-specific, highly regulated, or hardware-integration-dependent apps | MVPs, content apps, transactional apps, or multi-platform v1 on a budget |
If your app can live within the usual cross-platform constraints, you’re typically buying 30–50% lower build spend and ~1.5× faster launch for the same feature set, plus a simpler maintenance story over the next few years.
Progressive web apps vs. native
Developing a progressive web app (PWA) is akin to cross-platform app development. A PWA runs on both iOS and Android. It looks and feels like a native app, sort of a hybrid.
This website-app sits on your phone (with an icon, like other apps) and can be accessed even without an internet connection.

PWAs don’t support integration with phone hardware and most recent features in mobile OS versions (like push notifications or GPS).
Since PWAs are built using web technologies, they can save you budget when you have a web application and need a mobile companion. You can repurpose the web graphical assets adjusting them to the interface of a mobile solution, and connect the UI to the existing back end.
Pro Tip: use PWA to considerably cut your development budget for developing a mobile companion app for a web application. PWA may cost around 30 percent of the native app development budget and never come close to the native iOS app development cost.
PWA cost-benefit comparison
PWAs sit between “plain web app” and “full native,” trading some hardware access and UX fidelity for a much friendlier budget and maintenance curve.
| Dimension | PWA (Progressive Web App) | Native iOS + Android app |
|---|---|---|
| Initial build cost | ~$30k–$80k for a solid PWA MVP | ~$100k–$250k+ for two native apps with shared backend |
| Relative cost vs native | Typically ~30–50% of a comparable native build (single codebase, web stack) | |
| Time-to-market | Faster: one codebase to design, develop, and test; no app store review gate | Slower: separate iOS/Android builds + store submissions and reviews |
| Distribution & reach | Runs in browser, can be “installed” to home screen; indexable by search, no store fees | Distributed via App Store / Google Play; better store discovery, but 15–30% store fees typical |
| Maintenance | One codebase to update; instant rollout to all users | Separate app updates per platform; users may lag on new versions |
| Key limitations | Limited / inconsistent access to push, GPS, sensors, advanced OS features (esp. on iOS) | Full hardware access, best performance, richer offline support, and advanced UX capabilities |
In practice, PWAs are easiest to justify when you already have (or plan) a substantial web app and need a budget-friendly mobile companion. They’re a poor fit for hardware-heavy flagship experiences.
Health apps vs. other software
The development costs of health apps run higher than other software. The markup spreads across four real spend categories: vendor due diligence (BAA chains, subprocessor maps, security questionnaires, vendor risk scoring), integration surface (EHR/EMR work that gets quoted in weeks and ships in months), compliance roadmap that grows alongside your data flows, and audit-trail engineering most quotes don’t account for. Skip those line items in your initial budget and the project either misses launch or arrives non-compliant.
The cheapest quote rarely works for health apps
Cheap quotes for health apps work the same way cheap quotes work everywhere: they skip the work. In healthcare that means skipping vendor security reviews, BAA chain audits, encryption-at-rest configuration, and the audit-trail logging you’ll be asked to produce six months later. Anyone quoting you a HIPAA-compliant build at $30k is either subcontracting compliance to a vendor you’d want to vet, or assuming you’ll add it post-launch. Compliance retrofits are the most expensive kind of refactor. Quotes that price compliance as line items are the ones worth comparing.
What to defer in v1 without breaking compliance
Some healthcare features can wait. Cutting these in v1 keeps the budget honest:
- Don’t store PHI in v1 if you can help it. If your initial users can give you data that isn’t PHI (workflow telemetry, anonymized usage), HIPAA scope stays out of v1. Add PHI handling once the product earns it.
- Postpone EHR integration. Electronic Health Records work is quoted in weeks and ships in months. If your v1 thesis doesn’t require live patient records, ship without EHR integration and add Epic or Cerner integration as a v1.5 milestone.
- Pick one platform first. Web-first for clinician-facing tools, mobile-first for consumer health. Going both at once doubles QA and review surface without doubling your learning rate.
- Lean on no-code/low-code for admin tooling. Patient-facing flows still need custom; internal dashboards, scheduling admin, reporting, and basic intake forms can ride on Retool or Bubble until traffic justifies a custom rebuild.
When high-end quotes make sense
Sometimes a $200k+ quote is the cheap option. If you’re selling into hospital systems, payers, large pharma, or government contracts, the procurement and security reviews on the buyer side will demand the same compliance and integration depth a serious build would have given you anyway. Skipping that work early just means rebuilding it under deadline pressure when a deal closes. Same logic applies if your product handles clinical decision support, ingests live EHR feeds from launch, operates under FDA SaMD scope, or supports billing/claims workflows.
Health app development is mostly the audit conversations the code has to survive. Budget for compliance explicitly. Defer where you can, pay where the buyer demands it. Most Topflight engagements end up on a middle path: ship something HIPAA-aware in v1, expand to full compliance as the business model requires it.
Platform selection decision matrix
At this point you know the menu (native, cross-platform, PWA, web). The real question is: given your constraints, what should you actually pick first? Use this as a rule-of-thumb matrix:
| Your situation / priority | Lean toward | Why it usually wins on cost/value |
|---|---|---|
| Very tight budget, need something in-market fast, mostly standard features | Cross-platform or Web | One codebase, fastest path to learning; matches the lower bands in the type-by-cost table. |
| Existing or planned web app, mobile is a companion (not the main product) | PWA or Responsive Web | Reuse web stack + assets; PWA is typically ~30–50% of full native spend for a comparable scope. |
| Performance-heavy or hardware-centric (BLE, sensors, AR, complex offline, etc.) | Native (iOS + Android) | Full hardware access, fewer edge-case limitations than cross-platform/PWA; you’re paying for control. |
| Need both platforms but can’t afford two full native builds on v1 | Cross-platform (React Native/Flutter) | Shared codebase gets you closer to feature parity on iOS + Android with ~30–50% less build effort. |
| Regulated / health, PHI handling, long-term product, or complex multi-stakeholder roadmap | Native or High-discipline cross-platform | Compliance, performance, long runway, and architectural cleanliness usually justify higher up-front spend. |
| Internal tooling, admin dashboards, desktop-first workflows, or back-office utilities | Web | Browser-based UX is cheaper to build and maintain; no app store friction, widest device coverage. |
The practical pattern we see in real projects: start with the cheapest platform that still lets you test your core bets, then “upgrade” to heavier stacks (native, multi-platform) only when real usage data justifies the extra six figures. FOMO doesn’t qualify.
Build vs. buy: is custom app development worth it?
Custom app development is worth it when the workflow makes the business work. That usually means existing tools don’t support the user behavior well, or the product depends on custom logic, compliance requirements, integrations, and data you need to control.
Buy when the workflow is generic. If you need a CRM, help desk, scheduling tool, analytics dashboard, CMS, or internal admin panel, buying or configuring an existing platform is usually cheaper than rebuilding one. No founder has ever won the market because their password reset screen was artisanal.
| Question | Buy / configure | Build custom |
|---|---|---|
| Is this workflow common? | Best fit for standard workflows like CRM, CMS, support, scheduling, analytics | Best fit for unusual workflows, proprietary logic, custom UX, and product rules your team owns |
| How fast do you need it? | Fastest path if an existing tool covers 70-80% of your needs | Slower upfront, better when you need control over roadmap and UX |
| How much flexibility do you need? | Limited by vendor features, APIs, pricing, and product direction | Full control over features, integrations, data model, and scaling path |
| What happens at scale? | SaaS fees and seat-based pricing can get expensive once workarounds pile up | Higher upfront cost, better long-term economics when the product becomes strategic |
A practical rule: buy the commodity parts and build the parts that make the product different.
For a healthcare app, that might mean using proven services for payments, messaging, analytics, and admin workflows. Then you custom-build the patient experience, clinician workflow, security model, and integration layer.
Custom development gives you control. The app development cost only makes sense when that control protects margin, owns the user experience, keeps the roadmap in your hands, or lets you ship a workflow competitors can’t copy with off-the-shelf software.
App development cost estimation by business categories
Category sets the starting band. A QR scanner and an EHR-integrated telehealth app live in different cost universes before anyone writes a feature spec. Twelve bands below, with the cost range, the timeline, what pushes you to the upper end, and the kinds of apps that fit.
Basic app development cost
- Cost: $30,000 to $50,000
- Duration: 1–3 months
- Examples: Simple informational apps, basic utility apps (calculators, QR scanners), single-task tools like timers or unit converters, minimal productivity apps.
- What pushes you to the upper end: The moment “basic” picks up a login, cloud sync, a second screen, or persistent state, the build stops being basic.
Data-based application development cost
- Cost & duration: $50,000 to $90,000, 2–4 months.
- Examples: Fitness trackers, diet apps, sleep monitoring apps, analytics dashboards.
- HIPAA drift: Anything touching identifiable health data lands you in the Healthcare band, not here. The architecture math changes completely.
Authentication application development cost
- Cost: $60,000 to $110,000
- Duration: 3–5 months
- Examples: Banking apps, secure healthcare apps, encrypted messaging apps, MFA-gated patient portals.
- Where the cost actually goes: Not auth itself, but everything wrapped around it: audit logs, role-based access, account recovery flows, and session lifecycle.
- Stack call: Auth0 or Cognito at the bottom of the band; custom OAuth at the top.
Social media app development cost
- Cost: $90,000 to $150,000
- Duration: 4–8 months
- Examples: Instagram-like photo-sharing apps, chat-based community apps, niche social networks, creator-economy platforms.
- What eats the budget: Media storage and CDN bandwidth, plus moderation tooling that gets underbudgeted on every brief we see.
eCommerce app development cost
- Cost & duration: $100,000 to $180,000, 5–9 months.
- Examples: Shopify-based storefronts, custom-built online stores, retail shopping apps with payment integrations, subscription-box commerce apps.
- Where the actual work is: Tax, returns, inventory sync, and fraud handling. Payments are mostly a solved problem at this point.
On-demand app development cost
- Cost: $120,000 to $200,000
- Duration: 6–10 months
- Examples: Food delivery apps, ride-sharing apps (Uber-like), home services booking platforms, on-demand grocery and pharmacy delivery apps.
- The cost spine: Real-time matching and geolocation. Get these wrong and the rest of the app doesn’t matter.
- The hidden second app: Provider/driver onboarding is often as big as the user-facing build.
If you’re trying to price an app like Uber, you’re at the upper end of this on-demand band. Real-time geolocation, multi-sided logistics, ratings, payouts, and fraud prevention each behave like separate mini-projects that push you far past a simple “book a ride” prototype.
Marketplace app development cost
- Cost: $140,000 to $220,000
- Duration: 7–12 months
- Examples: Airbnb-style rental marketplaces, peer-to-peer marketplaces, freelance service platforms, two-sided healthcare provider marketplaces.
- The two-sided tax: Two onboarding flows, two notification systems, two dashboards, two support workflows. You’re shipping two apps that happen to share a database.
- Trust is its own subproject: Identity verification, dispute resolution, escrow, and reputation scoring rarely fit inside the original scope doc.
IoT & hardware application development cost
- Cost & duration: Starts from $180,000+, 8–14+ months.
- Examples: Smart home control apps, wearable healthcare apps, connected car apps, industrial IoT platforms.
- What swallows weeks: BLE pairing UX, firmware-app coordination, OTA update flows, and certification cycles. Underestimate any of these and the timeline doubles.
Healthcare app development costs
- Cost: $150,000 to $300,000+
- Duration: 7–14+ months
- Examples: Telemedicine platforms, chronic care management apps, remote patient monitoring dashboards, EHR-integrated patient portals.
- Where the money and time go: Most of the HIPAA-bounded cost sits in audit prep and documentation, not the code itself. EHR sandbox availability is what stretches 6-month plans into 9-month projects, every time.
Fintech app development costs
- Cost: $150,000 to $320,000+
- Duration: 7–14+ months
- Examples: Digital banking apps, trading/investment platforms, personal finance managers, lending/origination apps with KYC/AML.
- The unskippable item: KYC/AML vendor integration. Pick the vendor before you scope the build, because their flows shape your UX.
- Who actually controls go-live: The bank or BaaS partner approval timeline, not your engineering team.
Education app development costs
- Cost: $80,000 to $180,000
- Duration: 4–9 months
- Examples: E-learning platforms, language learning apps, LMS companions, cohort-based course apps with quizzes and progress tracking.
- What decides the band: Video infrastructure (encoding pipelines, CDN delivery, storage tiers, and DRM) scales with usage, not feature count. B2B school-district sales pile on SSO, SCIM provisioning, WCAG-level accessibility audits, and FERPA-style data agreements.
Gaming app development costs
- Cost: $120,000 to $300,000+
- Duration: 6–12+ months
- Examples: Casual mobile games, mid-core strategy or RPG titles, multiplayer party games, gamified learning or fitness apps.
- Engine choice shapes the team: Unity at one cost profile, Unreal at another, native iOS/Android at a third, web/HTML5 at a fourth. Don’t pick this last.
- The post-launch bill: Live ops, content cadence, seasonal events, and balance patches usually outsize the launch dev cost.
Summary table: app development cost by category
| Business category | Cost band |
|---|---|
| Basic | $30k – $50k |
| Data-based | $50k – $90k |
| Authentication | $60k – $110k |
| Social media | $90k – $150k |
| eCommerce | $100k – $180k |
| On-demand | $120k – $200k |
| Marketplace | $140k – $220k |
| IoT & hardware | Starts from $180k+ |
| Healthcare | $150k – $300k+ |
| Fintech | $150k – $320k+ |
| Education | $80k – $180k |
| Gaming | $120k – $300k+ |
Category gives you a rough starting band. Feature complexity decides where in that band you actually land. That’s the next variable to look at.
App development cost depending on complexity of features
Some features are simple toggles. Others are entire systems in disguise. The fastest way to ballpark a build is to split them into two buckets: basic (table-stakes, predictable cost) and advanced (where the budget actually goes).
Basic features
Must-haves for most apps. Quick to ship, low per-feature cost:
- User login (email/password, Google, Apple, Facebook, or magic-link sign-in)
- User profile (editable fields, optional avatar, preferences, settings)
- Push notifications (standard alerts via FCM/APNs)
- Basic UI and navigation
- Contact forms
- Static content (About, FAQ)
- Basic analytics integration
Budget $1,000 to $6,000 per feature, depending on depth and edge cases.
Basic feature cost calculator
Before you get lost in line items, use the basic-features list as a budget sanity check. Treat the number you get as a floor.
To use the ranges in this section and the table below:
1. List only true basic features. Start with the bullets above (login, profile, notifications, analytics, static pages) and cross out anything that looks like a mini-system in disguise (marketplace, custom CMS, workflow builder, embedded LMS).
2. Assign a complexity tier per feature.
- Low: close to the bottom of the range (simple email/password login, static FAQ).
- Medium: mid-range (social login plus profile, basic push notifications).
- High: top of the range (multiple auth states, edge cases, custom flows, extensive validation).
- Stretch: well above the published range, for regulated builds (audit logs, complex permission models, deep edge-case handling, performance tuning).
3. Rough-sum the basic feature cost. Multiply each feature by a number in its range and add them up. That gives you a floor for UI plus backend work around the basics.
4. Compare against your overall budget. If your “basic features only” subtotal is already eating most of your planned spend, you’re not ready for the advanced features yet.
This doesn’t replace a proper estimate, but it will stop you from planning a $200k feature set on a $60k budget.
| Feature | Category | Estimated cost | Notes |
|---|---|---|---|
| User login | Basic | $1,000 – $4,000 | Email/password, Google, Apple, or magic-link login |
| User profile | Basic | $1,000 – $3,000 | Editable fields, avatar, preferences, settings |
| Push notifications | Basic | $1,500 – $3,000 | Standard alerts via FCM or APNs |
| Basic analytics | Basic | $1,000 – $2,000 | Firebase, Google Analytics setup |
| Static content | Basic | $500 – $1,500 | About, FAQ, Terms, Privacy Policy pages |
Advanced features
These change your app’s architecture, backend, QA cycles, and operations budget:
- API integrations (Stripe, Twilio, Google Maps, social auth providers)
- Machine learning & AI
- e-Commerce systems
- Geolocation with routing/geofencing
- Use of phone sensors (gyroscope, NFC, etc.)
- IoT & BLE device integrations
- Accessibility features (compliance with WCAG, ADA, etc.)
| Feature | Category | Estimated cost | Notes |
|---|---|---|---|
| API integrations | Advanced | $4,000 – $6,000 per integration | Payment, maps, messaging, push services |
| Machine learning / AI | Advanced | $20,000 – $50,000+ | CoreML, ML Kit, custom on-device models, or cloud-based APIs |
| eCommerce module | Advanced | $15,000 – $40,000 | Cart, payments, product catalogs, checkout flows |
| Geolocation | Advanced | $4,000 – $10,000 | Map display, routing, geofencing, location history |
| Phone sensors | Advanced | $2,100 per sensor | Gyroscope, NFC, barometer, accelerometer |
| IoT integrations (BLE) | Advanced | From $9,000 | External hardware connectivity |
| Accessibility compliance | Advanced | $15,000 – $25,000 | WCAG, ADA, Section 508, EAA/EN 301548 support |
How advanced features multiply app development costs
The more complicated the app, the more expensive it gets to ship.
A complex app pulls in third-party integrations, server-side logic, admin tooling, and mobile hardware like BLE. Account for developer time and the ongoing subscription costs of third-party services.
Each new layer adds cost (databases, ML libraries, front-end frameworks, payment gateways, analytics stacks). The exact total depends on what you’re building, whether that’s building a marketplace app, a stock trading and investing platform, a medical app that uses blockchain, or creating a crypto token, or developing an apple watch app.

Tech and feature decisions are easy to underweight. List every feature you want, then star only the 2-3 that move your core metric. The rest waits.
Advanced feature ROI analysis
Advanced features are mini-products. The only sane way to greenlight one is to ask: what hard number does this move, and by how much? A simple checklist:
- Name the metric first. For an ML recommender in e-commerce, that might be conversion rate or average order value. For BLE/IoT integrations, it’s often time saved per user or reduced support/ops load.
- Compare cost vs. annual impact. If an AI module costs $30k–$50k to ship and maintain, what uplift (a +5% lift in revenue, a 20% drop in support tickets) would pay it back within 12–18 months? Slower payback bumps it to v2.
- Quantify operational savings. A BLE integration that saves nurses 5 minutes per patient at scale can beat a flashy but low-impact UX upgrade. Put a dollar figure on those minutes.
- Set a kill-switch. If early data doesn’t show movement on the target metric, be ready to cut the feature from future investment instead of doubling down out of sunk-cost guilt.
API integrations
Your mobile app needs to work with external service providers. Developers use API calls to add payment gateways, messaging platforms, geolocation, social networks, and analytics.
Pro tip: integrating an app with on-device system features like FaceID or Apple Auth is a low-cost investment (under $1,000 each). Making your app work with third-party services via APIs (social media, payments, etc.) usually runs $4,000-$6,000 per integration.
Machine learning
ML and AI are now standard. Apps rely on ML algorithms to personalize content and tailor flows to an individual user profile. The catch: ML-powered features run into five figures to ship and take months of dev time.
Pro tip: ask your app developers if Core ML (iOS) and ML Kit (Android) make sense for your use case. On-device ML keeps you off cloud-inference billing tiers, which compound fast at scale.

Related: Machine Learning App Development: The Complete Guide
e-Commerce
For a mobile shopping experience, we usually recommend a ready-made e-commerce platform like Shopify, BigCommerce, Magento, or WooCommerce. Plenty of other SaaS commerce options exist, but those four cover most use cases.
This off-the-shelf approach is a legit shortcut to push down the mobile app development price of a commerce app.
Geolocation
Geolocation cost depends entirely on scope. Map display sits at the bottom of the range. Routes, traffic data, geofencing, and location history each behave like mini-projects of their own.
Related: Location App Development: Steps, Tools and Best Practices
Pro tip: native mapping SDKs (Apple Maps, Google Maps) save money versus third-party mapping providers, especially once you scale into per-request billing tiers.
Phone sensors
Phone sensors enable advanced features:
- Proximity sensor
- Accelerometer
- Gyroscope
- Compass
- Barometer
- NFC
Apple and Google provide APIs to work with this hardware. The cost to build a mobile app goes up if we need to tap into phone hardware (except GPS, which is easy to access via third-party SDKs).
Pro tip: the cost of developing a mobile app that works with phone sensors should land around $2,100 per sensor.
IoT integrations
Apart from built-in sensors, apps often pull data from external devices like pedometers and heart-rate sensors. To enable this connectivity, developers need to work with a Bluetooth Low Energy protocol (BLE).
Pro tip: expect the best price per external-device integration to land around $9,000 (simple, low-code scenario).
A typical app and a custom build can differ by an order of magnitude in total cost. Worth pricing both before you commit to a direction.
Related article: How to Develop an IoT App
Accessibility options
Many businesses ignore accessibility, leaving customers with vision or hearing impairments without proper support.
A few standards to comply with:
- WCAG 2.1
- ADA Title III
- Section 508
- IS 5568
- EAA/EN 301548
Apps that win bake accessibility in from day one. Plenty of ready-made components and code templates make it cheaper to add at the start than to retrofit later.
Feature prioritization framework
When money is finite (it always is), treat your backlog as a portfolio of bets. Here’s a simple way to decide what actually makes it into the build.
1. Score every feature on three axes
Give each feature (basic and advanced) a 1–5 score for:
- Impact: how directly does it move revenue, activation, retention, or compliance? (1 = nice-to-have cosmetic, 5 = no product without this.)
- Effort/Cost: peg the score to the cost ranges in the tables. Lower-end items (lighter basics, modest integrations) sit at 1-3, and the heavier work (ML modules, complex e-commerce systems, BLE integrations, accessibility compliance) sits at 4-5.
- Risk/Unknowns: new tech, unclear UX, external dependencies, regulatory uncertainty (1 = proven pattern, 5 = we’ve never done this and neither have our users).
2. Calculate a simple priority score
For a quick gut-check, use: Priority = Impact / (Effort + Risk).
Sort features by this number. High-priority items are those where impact is large and the combined cost plus risk isn’t.
3. Decide what goes into v1
- Always first: high-impact, low–medium effort basic features that score well.
- Carefully: pick one or two advanced features with outstanding scores (core to your value prop).
- Hold: medium-impact features that might earn their slot in v1.1 or v2.
- Later: low-impact basics and high-risk advanced ideas become backlog or experiments.
This keeps v1 focused on a small set of high-leverage features instead of a bloated mix of “cool but hard” ideas.
MVP feature selection guide
For MVP, the right question is “what’s the smallest feature set that can prove we’re not wasting our time?”
Using the prioritization framework:
- Start with only high-priority basic features (top-scoring Impact / (Effort + Risk) from the tables).
- Add one, max two advanced features that are absolutely core to your value prop or hypothesis.
- Park everything else in a proper post-MVP backlog with explicit scope and budget.
- Re-score every parked feature once you have real MVP usage data.
If you can’t explain what a feature is supposed to prove, it doesn’t belong in v1.
Cost of adding GenAI (LLMs) to your app
Adding AI-powered features to your app is a financial decision as much as a technical one, and the bill compounds for years. Costs split into two categories: the upfront engineering investment for setup, and the ongoing operational costs that scale (or don’t) with usage.
Setup costs: building the foundation
Before a single token flows through your app, you’ll need specialized talent and infrastructure. LLM features differ from traditional software modules in one key way: they require engineers who understand probabilistic systems, prompt design, data retrieval, and evaluation pipelines.
Labor costs for AI/ML specialists (2026 rates):
| Experience level | North America | Western Europe | Eastern Europe | India/SE Asia |
|---|---|---|---|---|
| Junior (0-2 yrs) | $50-80/hr | $45-75/hr | $40-65/hr | $20-45/hr |
| Mid-level (2-5 yrs) | $80-140/hr | $70-120/hr | $60-100/hr | $40-80/hr |
| Senior (5+ yrs) | $140-250/hr | $120-180/hr | $100-160/hr | $80-130/hr |
Note: total hiring overhead typically adds 1.4x to 2.5x to base rates once benefits, tools, recruiting fees, and onboarding ramp are included.
If you’re building internal self-hosting capability, a minimal team usually includes 1.5 FTEs for AI/ML infrastructure, 1.0 FTE for DevOps/SRE, 0.5 FTE for evaluation/safety, plus shared security resources. That pushes annual staffing costs to $720,000 – $1,650,000 for a fully-loaded team.
The core setup work
Prompt engineering. Schema-first now: prompts built around strict data models (Pydantic, Zod) for structured, validated outputs. Budget 40-80 hours for initial development plus ongoing iteration.
RAG pipeline setup. If your app needs to answer questions about your data, you’ll need a Retrieval-Augmented Generation pipeline. This is usually the most labor-intensive piece. You’re building ingestion jobs that parse document formats (PDFs, Markdown, scanned images, HTML exports) and implementing semantic chunking strategies. Without proper RAG tuning, hallucination rates can hit 40% of responses.
Vector database. Cost scales with your data volume:
- Small deployments (<1M vectors): self-hosted options like Chroma or Qdrant cost $0-50/month
- Larger deployments (10M+ vectors): managed services like Pinecone run $70-500/month
Evaluation & safety. You’ll need automated testing harnesses to catch hallucinations and safety issues. For high-stakes B2B applications, expect to manually review 15-20% of interactions on top of that. Safety/guardrails layers (NeMo Guardrails, Guardrails AI) add implementation time for PII filtering, toxicity detection, prompt injection protection, and PHI redaction for healthcare workloads.
Ongoing inference costs: the trap
Here’s where many teams get burned. The choice between API-based and self-hosted inference can land you in completely different cost universes.
Option A: “API wrapper” costs (pay-per-token)
Using managed APIs from OpenAI, Anthropic, Google, or AWS Bedrock means you pay only for what you use. At low volumes, this is dirt cheap.
Current API pricing (per 1M tokens, May 2026):
| Provider/Model | Input | Output | Cached input | Best for |
|---|---|---|---|---|
| OpenAI GPT-5.4 | $2.50 | $15.00 | $0.625 | Balanced flagship |
| OpenAI GPT-5.4 Mini | $0.75 | $4.50 | $0.19 | High-volume tasks |
| OpenAI GPT-5.4 Nano | $0.20 | $1.25 | $0.05 | Classification, extraction |
| Claude Sonnet 4.6 | $3.00 | $15.00 | $0.30 | Documentation, analysis |
| Claude Haiku 4.5 | $1.00 | $5.00 | $0.10 | Speed/classification |
| Gemini 3 Flash | $0.50 | $3.00 | $0.05 | Multimodal, high-throughput |
| Gemini 2.5 Flash-Lite | $0.10 | $0.40 | $0.01 | Budget multimodal |
Note: frontier-tier models (OpenAI GPT-5.5 at $5/$30, Claude Opus 4.7 at $5/$25, Gemini 3.1 Pro at $2/$12) sit above this table; use them when reasoning quality justifies the premium. OpenAI cached input is 25% of base; Anthropic and Google cached input is roughly 10% of base.
For a low-usage pilot (1,500 sessions/month with ~3,000 tokens per session), managed APIs cost roughly $0.02 per session on GPT-5.4 Mini or Claude Haiku 4.5, or about $25-30/month total.
Option B: self-hosted/fine-tuned model costs (the trap)
The moment you move to self-hosting (for data privacy, fine-tuning, guaranteed throughput, or regulatory isolation), you switch from variable to fixed costs. The GPU is billed 24/7 whether it processes tokens or not.
Self-hosting cost reality (Llama 3.1 models):
| Model | Deployment | Monthly infra cost | Throughput |
|---|---|---|---|
| Llama 3.1 8B (8-bit) | Single GCP L4 | $775-820 | ~9 req/sec |
| Llama 3.1 8B (8-bit) | HA (2 nodes) | $1,540-1,650 | ~18 req/sec |
| Llama 3.1 70B (4-bit) | Single A100 | $1,320-1,380 | ~2.6 req/sec |
| Llama 3.1 70B (4-bit) | HA (2 nodes) | $5,450-5,600 | ~5 req/sec |
Costs include compute, load balancer, storage, and observability. Does not include staffing.
The math that exposes the trap:
At that same 1,500 sessions/month pilot scale:
- Managed API (GPT-5.4 Mini): ~$0.02 per session, about $25-30/month total
- Self-hosted (Llama 8B, single L4): $800/month flat regardless of usage
That’s a 25-30x price difference. The GPU runs 730 hours per month but actively processes tokens for less than 3 hours total. You’re paying for idle capacity.
When self-hosting makes sense
The economics flip at sustained scale. For Llama 8B HA at $1,620/month, the break-even against managed APIs lands roughly at:
- GPT-5.4 ($2.50/$15) on 3K-token sessions: ~80,000 sessions per month
- Claude Sonnet 4.6 ($3/$15) on 3K-token sessions: ~70,000 sessions per month
- Frontier APIs (GPT-5.5, Claude Opus 4.7) on 3K-token sessions: ~30,000-50,000 sessions per month
- Moderate-complexity sessions (8-10K tokens each on frontier models): 15,000-25,000 sessions per month
In token volume terms, that’s roughly 5-20 billion tokens per year depending on which API tier and session size you’re replacing.
But there’s a catch: if your use case needs the reasoning quality of frontier models (Claude Opus 4.7, GPT-5.5), an 8B open-weight model may not cut it. And if you use a smaller managed API like GPT-5.4 Mini ($0.005-0.01 per 3K-token session), it often remains more cost-effective than self-hosting at any volume up to a few hundred thousand sessions per month, while eliminating infrastructure overhead entirely.
The hidden “trap” of dedicated capacity
The most frequent source of budget overruns shows up when teams move from pay-per-token to dedicated capacity. The usual triggers: fine-tuning on proprietary data, or guaranteed throughput SLOs.
AWS Bedrock Custom Model Units: ~$4.71/hour or $3,438/month per unit (two units for HA = $6,876/month minimum, even with zero requests).
Azure Provisioned Throughput: minimum 15 PTUs for GPT-5.4 at ~$1/PTU/hour = $10,800/month baseline.
Then there’s the SLO sizing trap: if a single A100 handles 20 concurrent users but your peak concurrency is 50, you need 3 nodes. During the 14 hours per day when concurrency drops to 5, those extra nodes are still billed. Effective utilization can drop below 15%.
Quick reference: API vs. self-hosted
| Factor | Managed API | Self-hosted |
|---|---|---|
| Cost at low volume | ✅ Pennies per session | ❌ $500-5,000+/month minimum |
| Cost at high volume | ❌ Scales linearly | ✅ Amortized fixed cost |
| Setup complexity | ✅ API key + SDK | ❌ GPU provisioning, MLOps tooling, monitoring, on-call rotations |
| Data privacy | ⚠️ Data leaves your infra | ✅ Full control |
| Fine-tuning | ⚠️ Limited options | ✅ Full flexibility |
| Staffing needs | ✅ Minimal | ❌ Requires dedicated MLOps/SRE |
| Break-even point | N/A | ~5-20B tokens/year (varies by API tier) |
Recommendations
- Start with managed APIs. Unless you have regulatory requirements forcing self-hosting, begin with pay-per-token APIs. The cost at low volume is pennies per session, and you avoid infrastructure complexity.
- Use the smallest model that works. GPT-5.4 Nano ($0.20 input) or Gemini 2.5 Flash-Lite ($0.10 input) per 1M tokens handles many classification and summarization tasks. Don’t pay frontier model prices for commodity work.
- Implement caching aggressively. Prompt caching can reduce input costs by 75-90% for repeated context (depending on provider). Semantic caching can cut total API calls by 60-85% for high-repetition workloads like customer support.
- Model your break-even point before self-hosting. Calculate your actual token volume. Then total your real costs: GPU hours, staffing, monitoring, HA requirements, and observability tooling. The non-GPU lines usually dominate.
- Watch out for the “fine-tuning trigger.” The moment someone says “we need to fine-tune,” your cost structure shifts entirely. Make sure the quality improvement justifies the 10-100x infrastructure cost increase.
App development costs by region
App development hourly rates can swing 5x or more across regions. The useful planning question is which blend of cost, time-zone overlap, domain expertise, senior oversight, and delivery risk fits the product you’re building.
That distinction matters because pricing varies more by engagement model than by geography alone. Solo freelancers, staff augmentation contracts, outsourcing vendors, boutique agencies, and full-service product teams all get stuffed into the same “developer rate” bucket online. That’s how cost tables turn into spreadsheet cosplay.
For healthcare and other regulated apps, the higher band usually reflects a senior-heavy delivery setup. You’re paying for architecture, DevOps, security, QA, PM, product strategy, compliance-heavy workflows, and stakeholder management. That premium only makes sense when those roles are actually in the delivery model.
| Region | Typical outsourcing vendor / staff augmentation / dev shop | Senior-heavy regulated delivery team or key-role equivalent | Best for | 2026 note |
|---|---|---|---|---|
| North America (US/Canada) | $85-$180/hr | $150-$250+/hr | High-touch discovery, product leadership, architecture-heavy healthcare platforms, US/Canada stakeholder alignment | Still the most expensive region. The premium often buys faster decisions, stronger product ownership, tighter alignment with US healthcare expectations, and easier executive communication. |
| Western Europe (UK, DACH, Nordics, etc.) | $70-$150/hr | $130-$200+/hr | GDPR-heavy products, enterprise integrations, multilingual EU delivery, strong engineering governance | Western Europe remains premium, especially in the UK, Germany, the Netherlands, and the Nordics. Rates vary sharply by country and agency type. |
| Eastern Europe | $30-$80/hr | $65-$120/hr | Strong cost-to-quality ratio for web, mobile, backend, SaaS, and well-scoped regulated builds | Commodity offshore rates have softened, while senior engineers, architects, DevOps leads, and regulated-product teams still command a premium. |
| Latin America | $35-$85/hr | $70-$130/hr | Nearshore delivery for US teams, time-zone overlap, fast iteration, feature pods | Latin America held pricing better than some offshore regions because time-zone alignment is still valuable. Brazil and Mexico sit toward the higher end, especially for senior nearshore teams. |
| India / South Asia | $20-$55/hr | $50-$100/hr | Large-scale team ramp-ups, QA, maintenance, backend work, support, cost-sensitive execution | India remains a scale leader. The best results come when requirements are clear, product leadership is strong, and senior architecture stays close to the decision makers. |
| Southeast Asia | $20-$50/hr | $45-$90/hr | Well-scoped mobile/web execution, QA, support, cost-focused builds | Vietnam, the Philippines, Indonesia, and Malaysia can be cost-effective for bounded work. Treat the premium band as senior or specialist capacity, rather than the default regional rate. |
Note: These are broad 2026 planning ranges, rather than quotes. “Typical” means outsourced vendor, staff-augmentation, or dev-shop pricing. It excludes solo freelancer marketplace rates, which are often materially lower. “Senior-heavy regulated delivery team” means either a blended healthcare squad with architecture, DevOps, security, QA, PM, compliance-heavy workflow, and stakeholder management, or the upper band of those key roles. A senior developer in that region will not automatically charge that rate.
Why hourly rates changed in 2026
In 2026, app development rates split into 2 markets.
AI-assisted development put pressure on routine implementation work: boilerplate code, CRUD screens, test generation, documentation, simple refactoring, and repetitive QA support. That created selective rate softening in offshore, execution-heavy markets, especially where vendors historically competed on labor arbitrage.
The safe editorial line is selective softening. A universal 2026 rate collapse would be lazy and wrong.
The expensive parts of serious app development stayed expensive. Senior architecture, security design, DevOps, QA strategy, product judgment, stakeholder alignment, and healthcare compliance still require experienced people. In healthcare, that matters even more because HIPAA, access controls, audit logs, privacy architecture, vendor review, and release discipline are problems you solve with senior judgment. Autocomplete and good vibes will not carry that audit.
AI also creates new cost categories. Model API usage, vector databases, evaluation workflows, AI monitoring, safety controls, compliance review, and governance work can sit on top of build cost. AI may reduce some development hours, while regulated product development still needs the people and process that keep the app safe in production.
North American development costs (US/Canada)
North America typically has the highest development hourly rates. That premium can make sense when the project has regulatory risk, messy stakeholders, unresolved product decisions, and architecture choices that will be expensive to unwind later.
You’re often paying for decision speed, direct access to senior product and architecture leads, stronger communication with US-based executives, and familiarity with US healthcare expectations.
Best fit: discovery, product strategy, UX leadership, architecture, compliance-heavy planning, healthcare integrations, and executive-facing delivery.
Smart play: keep the product and architecture spine here if your primary market is the US or Canada. Then blend delivery pods from other regions once scope is clear.
European development pricing (Western and Eastern Europe)
Europe splits into 2 practical markets.
Western Europe sits closer to North America on price, especially in the UK, Germany, the Netherlands, Switzerland, and the Nordics. It works well for GDPR-heavy products, enterprise-grade engineering, strong governance, and teams that need tighter regional context.
Eastern Europe remains one of the stronger cost-to-quality options for app development. Poland, Ukraine, Romania, Bulgaria, the Baltics, and neighboring markets can support mature web, mobile, backend, and SaaS delivery at lower rates than Western Europe or North America.
The 2026 nuance: Eastern Europe saw some AI-linked softening in commodity execution rates. Senior Eastern European talent did not suddenly become cheap. Architects, DevOps leads, security specialists, and healthcare-experienced teams still move into a higher band.
Latin American development options
Latin America often plays the nearshore role for US-based founders: mid-range rates, overlapping working hours, generally strong communication, and faster iteration loops. The time-zone overlap is the product.
This region works well for feature delivery pods, QA, DevOps support, maintenance, incremental roadmap work, and collaboration-heavy builds where same-day feedback matters. Brazil and Mexico tend to sit toward the higher end. Colombia, Argentina, Chile, and other markets may offer more flexible pricing depending on seniority and engagement model.
Latin America is weaker when the project needs messy early discovery, regulatory strategy, unresolved stakeholder alignment, or deep healthcare architecture from scratch. Those decisions usually anchor better with a senior team closer to the primary market.
India and South Asia development markets
India and South Asia remain strong for scale, cost control, QA, support, backend work, maintenance, and well-specified execution. If you know what needs to be built, have a strong internal product owner, and can document requirements clearly, this region can deliver real savings.
Ambiguity is where the savings go to die. Vague scope plus distant delivery equals expensive rework wearing a cheap hourly-rate costume.
For healthcare products, keep architecture, security, compliance, and clinical workflow decisions close to senior leadership. Use South Asian teams for bounded execution streams once those decisions are clear.
Southeast Asian development markets
Southeast Asia, including Vietnam, the Philippines, Indonesia, and Malaysia, can be highly cost-effective for scoped mobile/web development, QA, support, and execution-heavy workflows. Vietnam is often strong for engineering delivery. The Philippines can be useful for communication-heavy support and QA-adjacent roles.
The region works best when the work is well-bounded: clear specs, clear acceptance criteria, clear handoffs, and a product owner who can make decisions quickly. It is less ideal when you’re still figuring out the product, the compliance model, or the architecture.
Remote team cost benefits
The biggest savings usually come from combining regions deliberately. Picking the cheapest region rarely beats a thoughtful blended model.
A common effective structure looks like this:
- North America or Western Europe: product strategy, UX leadership, architecture, healthcare compliance, stakeholder alignment.
- Eastern Europe or Latin America: core delivery engine for web, mobile, backend, QA, DevOps, and roadmap execution.
- India / South Asia or Southeast Asia: well-bounded execution work, QA, maintenance, support, and cost-sensitive implementation.
- Specialized contractors: security audits, compliance review, AI evaluation, penetration testing, and niche integrations.
Done well, this blended model lowers your effective hourly rate without putting the hard decisions in the cheapest possible hands.
Done poorly, it creates a global Slack channel where every time zone is awake except the one person who knows why the app is broken. Not ideal.
App development cost depending on the team
Engineering talent is one cost driver. Designers, PMs, QA leads, architects, and DevOps all add to the team mix that shapes your final number. Successful apps need that balance of skills, ready to adjust to market conditions on the fly.
Where does the budget actually go? Typical team roles and their cost impact, from lean MVPs to full enterprise builds:
| Team role or function | Lean build (simple app) | Full feature set (medium app) | Enterprise-grade (complex app) |
|---|---|---|---|
| Timeline (est.) | 2–5 months | 5–8 months | 8–14+ months |
| Lead Engineer / Dev Team | $25,000 – $40,000 | $50,000 – $70,000 | $100,000+ |
| Product Designer (UI/UX) | $3,500 – $6,000 | $6,000 – $9,000 | $12,000 – $16,000 |
| Technical PM | $4,000 – $6,000 | $8,000 – $14,000 | $12,000+ |
| QA / Test Automation | $7,000 – $10,000 | $14,000 – $20,000 | $20,000 – $25,000 |
| Product Strategist / BA | $2,500 – $4,000 | $5,000 – $8,000 | $9,000 – $11,000 |
| DevOps / Cloud Setup | $2,500 – $4,000 | $5,000 – $8,000 | $10,000+ |
| Solution Architect | $2,000 – $3,000 | $6,000 – $9,000 | $10,000 – $15,000 |
| Total investment (est.) | $20,000 – $55,000 | $55,000 – $110,000 | $120,000+ |
Outsourcing vs. in-house team
It’s more expensive to hire a full-stack in-house team than to outsource app development to an app development agency. You’re paying for recruiting plus knowledge transfer, neither of which factors into outsourced project costs.

There are several other roadblocks to hiring your own team, especially if you want to keep time-to-market reasonable:
IT administering
Depending on the scale of a project, you’ll need an IT management unit: someone handling network, security, servers, and the build tooling that keeps the development process moving.
CTO and project managers
Developers and designers need coordination. Their interactions with other company units need to stay clear and predictable. Hire a CTO and project managers to handle that, or budget for the expenses and manage everybody yourself.
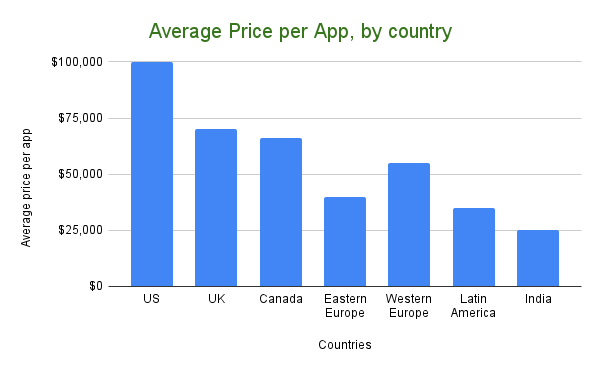
Equipment and office space
Office, computers, monitors, servers, and the rest of the dev hardware add up fast.
Workload balance
Workload runs uneven across the development process. Slow weeks make a full-time hire look underused; busy weeks have you wishing you had one. Juggling tasks between dev team members adds complexity that costs more than it saves.
Company culture
Developers do their best work in places that live their stated values and back their teams day-to-day.
Benefits, paid leave, etc.
And remember the “extra” costs of having your own team: 401k matching, employer taxes, equity, and paid leave.
Outsourcing simplifies things. Your outsourcing partner handles staffing, delivery timing, budget compliance, and accountability when things slip. Just remember to choose the right app developer when you outsource.
Some India-based agencies offer lower hourly rates for app development, but quality varies sharply across vendors. Budget shops often cut corners on senior talent, and the savings get eaten by delivery slips and rework that derail your marketing timeline.
If you need your product in the App Store and Google Play on time and on budget, opt for a near-shore option. Even though the median price for a basic app in some countries (Eastern Europe, for example) sits around $10K, plenty of small business owners end up rebuilding their iPhone and iPad apps because the low hourly rate hid quality compromises.
By the time they’re done, total cost often runs higher, sometimes twice the original low quote that pulled them in.
Pro tip: an average annual after-tax cost per developer in the US is around $100,000. That number could cover the entire build of your product with an outsourced team, which will use more resources than a single developer and ship faster. The cost to have an app developed depends heavily on whether you can outsource and on the average hourly rate.
Freelancer vs. agency cost comparison
The harder question behind picking a vendor: how much of a team are you willing to assemble and manage yourself? That choice drives everything else.
| Dimension | Freelancer | Agency / Product Studio |
|---|---|---|
| Typical rate structure | Hourly / day rate per person | Blended rate across roles |
| Included roles | 1–2 (dev, maybe designer) | Dev, design, PM, QA, architecture as needed |
| Coordination & oversight | You (or your PM) | Agency PM / tech lead |
| Bus factor / continuity | High risk if one person disappears | Lower risk; multiple people know the codebase |
| Best suited for | Small spikes, prototypes, narrow features, single integrations | Multi-feature v1s, complex or time-sensitive work |
When a freelancer makes sense:
- You have a small, well-defined task (a single integration or UX polish).
- You already have strong internal product and engineering leadership to manage them.
When an agency is cheaper in total:
- You need multiple skills at once (design + backend + mobile + QA).
- Your priorities include time-to-market and long-term maintainability, both of which a headline hourly rate hides.
The math many founders miss: freelancer stacks come with a hidden coordination tax. Once you factor in your time managing four vendors, a cross-functional agency pod often wins on total cost.
Offshore vs. onshore development costs
Picking a geography is a different trade: how much hourly-rate savings are you willing to pay for in coordination risk and rework? That trade sets the rest of the decision.
Apply the onshore/near-shore/offshore framing to the regional rate bands above.
| Model | Typical regions | Blended rate signal | Where it wins | Main risks |
|---|---|---|---|---|
| Onshore | US/Canada, Western Europe | Highest (top of the ranges) | Complex products, regulated domains, tight deadlines, contentious stakeholders | Highest burn rate; you still need a strong team |
| Near-shore | Eastern Europe, LATAM | Mid-range (roughly half to two-thirds onshore) | Best balance of cost, quality, time-zone overlap, and communication speed | Vendor quality varies; still needs strong product lead |
| Offshore | India, parts of SE Asia and beyond | Lowest (bottom of the ranges) | Cost-sensitive builds, well-specified work, strong internal PM, mature documentation practices | Higher odds of misalignment and rebuilds |
How to decide:
- If time-to-market and quality are existential, keep product and architecture onshore and treat offshore as a tactical lever for specific work streams.
- If budget is absolutely capped, start offshore or near-shore, but plan for a real QA plus code review layer (or a future rebuild baked into your financial model).
Hybrid team cost models
Most real products are hybrids. You keep decision-making and architecture close, and distribute implementation and QA to where it’s cost-effective.
A practical way to think about hybrid models:
Model 1: onshore product spine, near-shore/offshore delivery. Onshore covers product owner, UX, tech lead, and architect. Near-shore or offshore handles 2–5 engineers plus QA. You get onshore context and decision speed, with a blended rate closer to a near-shore team than a pure US squad.
Model 2: embedded specialists + remote pod. One senior engineer or architect embeds with your onshore team. A near-shore or offshore feature team handles backend, mobile, web, and QA. The architect enforces standards and code quality so you don’t pay the classic “cheap now, rebuild later” tax.
Model 3: follow-the-sun for scale-ups. Onshore covers product, design, engineering lead, and QA lead. Multiple pods across regions handle different modules and time zones. Overkill for early-stage, but powerful once you have a validated product and a heavy roadmap.
Model 4: augmented in-house with external specialists. Your existing in-house team plus contracted specialists for periodic deep dives (security audits, ML model tuning, performance optimization, or compliance review). Works when your team has most of the skills but needs targeted depth on specific problems.
Hybrid teams often land 20–40% cheaper than pure onshore while avoiding the coordination tax of fully unmanaged offshore teams. The key is having one clear owner for product decisions and technical direction, regardless of where the rest of the team sits. The country list matters less than that.
Team size optimization
Start with the smallest cross-functional squad that can actually ship this thing.
Use your scope and the team-role table above as anchors:
- Simple MVPs: 1 product owner, a part-time designer, 1–2 full-stack/mobile devs, and part-time QA is usually enough. If you need a dedicated architect, you’re probably over-engineering v1.
- Growing products: move toward a 4–6 person squad (PM, designer, 2–3 devs, QA). Beyond ~6 people, coordination overhead starts eating the speed gains unless the work is cleanly parallel.
When (and how) to add people:
- Add one role at a time to relieve a visible bottleneck: QA drowning, UX backlog, backend blocking mobile, or deploys blocked on DevOps. Adding people because you have budget is the trap.
- Keep a close eye on utilization: if multiple people are consistently under 60–70% loaded, your team is too big for the current roadmap.
A simple rule of thumb: if adding another developer creates more meetings than shipped features, you’ve passed the optimal team size.
Hidden app development costs
Besides design and development services, several things shape app development costs but slip through the cracks, especially when you’re getting a quote from a rookie.

Back-end development
Behind the front end, you need back-end code for business logic and data storage. A web admin app for managing content and users usually rides alongside.
SaaS and SDK fees
Companies often plug in SaaS services and paid SDKs to ship faster (Chargebee for subscriptions, Google Maps for location). Any decent partner flags monthly subscription costs upfront and helps you model spend against your customer base.
Server hosting
Account for hosting costs in your budget. Get estimates from a few providers before committing.
Project management
In-house or outsourced, project management is real work. Development companies don’t include your managerial effort in their cost estimates. You should.
App marketing
You’ll need to budget for marketing (app store optimization, affiliate partnerships) before your product hits the app stores.
Also read: Topflight’s growth story: 1400% increase in traffic
The “compliance tax” in healthcare app development
If your product creates, receives, stores, or transmits PHI, compliance is a parallel security workstream that runs alongside design and development. And it comes with real costs.
This is also why a “$5k healthcare app” quote is usually a red flag. Either the scope quietly avoids PHI, or someone is skipping the work that hospitals and serious buyers will eventually demand.
What that compliance budget typically covers:
| Compliance workstream | Typical budget range | How often it shows up | Why it exists |
|---|---|---|---|
| HIPAA Security Risk Analysis (SRA) | $1,000–$10,000 (small org) / $20,000–$50,000+ (enterprise) | Typically annual | Required foundation: inventory, threats, vulnerabilities, and a mitigation plan. |
| Penetration testing (web / API) | $5,000–$30,000 (web) / $6,000–$30,000 (API) | Typically annual | Tests real-world exploit paths, especially auth, RBAC, data exposure, and session management. |
| Mobile pentest (per OS) | $7,000–$35,000 (per OS) | Typically annual | Mobile brings its own fun: local storage, traffic interception, binary analysis, jailbreak/root detection. |
| Cloud environment testing / review | $10,000–$50,000+ | Typically annual (or major changes) | IAM, storage exposure, infra-as-code, cross-tenant risk. |
| Vulnerability scanning (managed) | $800–$4,500/year | Typically quarterly/continuous | Catches CVEs and config drift continuously; runs alongside annual pentest cycles. |
| Remediation & gap closure | $1,000–$10,000+ (often internal labor) | As needed | Fixing what scanning and pentests find (usually the biggest “hidden” piece). |
| HIPAA policy package | $1,000–$5,000 | Usually one-time, then updated | Admin safeguards: incident response, DR, access procedures, audit logging. |
| Annual staff HIPAA training | $30–$100 per user/year | Annual | Required annually; auditors check completion dates per employee. |
| Vendor due diligence (per vendor) | $200–$3,500 per vendor | Per vendor / periodic | Reviewing vendors that may touch PHI (security questionnaires, artifacts, risk tiering, subprocessor review). |
| Legal review of BAAs (per vendor) | $320–$1,250 per vendor | Per vendor | Negotiation and liability terms for PHI-handling vendors. |
| Compliance automation / GRC tooling | $8,000–$12,000/year (example range) | Recurring | Helps avoid the once-a-year panic sprint of evidence collection. |
Compliance stages
A practical way to budget compliance spend is to match it to your stage. This keeps you from overpaying too early or underpaying until it hurts.
- Stage 1 (MVP / pilot): $5k–$25k. Focus on HIPAA basics: BAAs where needed, encryption, basic SRA, minimal policies.
- Stage 2 (v1 / growth): $40k–$100k. Add market-credibility artifacts (stronger testing, automation, first audit steps, vendor due diligence).
- Stage 3 (enterprise / hospitals): $150k–$350k+. Layer in external attestations and the operational overhead that comes with them.
- Stage 4 (multi-customer SaaS / regulated platform): $400k+. Add HITRUST or SOC 2 Type II attestations, a formal security program, dedicated GRC headcount, and ongoing third-party assessments.
The compliance cost few teams budget for
If you sell to hospitals, one of the nastiest hidden costs is the vendor security questionnaire: 300–500 questions, lots of back-and-forth, real opportunity cost in senior engineering and legal time, plus distraction from product work. Teams often burn roughly $20,000–$150,000 worth of internal effort if handled manually.
If you’re building in this space, see how our healthcare app developers structure compliance and integration work from day one.
Optimizing app development costs
Seasoned app developers have a few tricks up their sleeve to kick down the cost to develop an app. Use these to guard your app budget.
Research product-market fit
Know the target audience for your app type (ideal customer persona): their real needs and the context for using the app throughout a day. Use those answers to scope ruthlessly.
Create a prototype
Verify your findings by creating a prototype of the app to keep costs under control. Clickable prototype updates based on user feedback are far less expensive than code changes. Otherwise, the price of building your mobile software can climb fast.
Run project management with agile
Once you lock in the final list of app features and the app’s look and feel, it’s time to build the app. At that point, your app-making budget will start to melt noticeably.
To make sure every dollar of the budget contributes to the bottom line, you need a project management framework. We practice and recommend Agile with weekly sprints because it helps balance development progress with spending.
The benefits of agile come down to:
Transparency
At any moment during development, our partners know precisely how each team member allocates their working hours, which lets us project budgets for future sprints accurately.
Flexibility
Specs evolve once you start releasing or testing early versions. Agile favors flexibility, letting the dev team add features, cut knickknacks, prune scope, and pivot on what’s working. The product starts generating traction right after release.
Also read: AR App Development Guide
Quicker time to market
Agile’s retrospective and early adopters’ feedback mean we launch faster. Spec light at the start; iteration adds detail based on what you’ve learned. Every iteration focuses on ROI goals.
Lean budget
Working with an agile team is like hiring a full-stack department of cross-discipline specialists (design, testing, development, DevOps, etc.) without keeping everybody on full-time payroll.
Also read: DevOps Implementation Plan: Everything You Need to Know
Every expert gets involved proportionally to the value they bring to the table. Business owners avoid costly mistakes from spending hundreds of hours on useless development.
The budget adjusts with your team’s velocity, depending on how many experts are allocated to your project per month and the number of hours they put into your product.
Stick to the scope
To keep the original estimated app development budget, stick to the feature set from the prototyping stage. Put off add-ons and new options until later stages when you can assess whether you have the bandwidth.
By now you should have enough info to answer “how much does it cost to build an app?” with reasonable accuracy. The final number should land close to your estimate.
Pre-development cost savings
Most of your savings potential lives before anyone opens an IDE. Think of pre-development as a filter that catches expensive mistakes early.
Tactical levers:
- Start with a ruthless problem brief. One page: problem, target user, key jobs-to-be-done, and 1–2 success metrics. Anything that doesn’t serve that brief is a “later” idea by default.
- Do cheap validation first. Customer interviews, click-through Figma prototypes, rough pricing models, and concierge MVPs are far cheaper than writing and rewriting production code. Use the prototype to kill weak ideas as much as to polish strong ones.
- Constrain the tech stack on paper. Decide up front where you’ll lean on SaaS/SDKs (auth, payments, messaging, analytics) vs. custom builds. Pre-selecting “pre-made” blocks caps scope before devs start inventing bespoke solutions.
- Pre-negotiate scope and guardrails with your vendor. Agree on what a “v1” excludes: surprise platforms, stealth advanced features, last-minute redesigns, and last-week feature add-ons. That alignment alone can save tens of hours later.
Everything you do here is what makes the rest of the optimization work pay off.
Development phase optimization
Once the team is sprinting, optimization is about shaping the work so it burns budget cleanly.
Practical ways to do that:
- Enforce small, vertical slices. Each story should deliver a user-visible sliver (UI + backend + tests + observability). Big technical “layers” with no user impact are where budgets disappear.
- Limit work in progress. Too many open tickets means nothing finishes, context switching explodes, QA becomes a traffic jam, and PRs sit waiting for review. Fewer concurrent items = more finished value per sprint.
- Use a strict Definition of Ready / Done. No vague tickets; each story has acceptance criteria, test expectations, UX assets, and clear edge cases attached. “Done” means merged, tested, deployed to staging, and verified by QA in a production-like environment.
- Standardize tools and patterns. One frontend stack, one backend style, shared components, common CI pipeline. Every deviation from the norm should earn its existence with a real business reason.
- Track cost per epic. Roll hours and spend up by feature area for visibility beyond sprint-level reporting. When one epic starts to dwarf the rest, you can de-scope or park it before the budget silently doubles.
Post-launch cost reduction
After launch, the goal shifts from “ship” to “stabilize and prune.” A few months of disciplined cleanup can shave a lot off your ongoing burn.
Focus on:
- Turning off what no one uses. Use analytics to find dead or low-usage features and either hide, deprecate, merge, or remove them entirely. Every active feature has a maintenance tax.
- Right-sizing environments and tooling. Scale cloud resources to actual measured usage. Launch-day overprovisioning leaves room to cut once traffic settles. Consolidate overlapping SaaS tools (analytics, support, feature flags, error monitoring) once you know which ones you actually lean on.
- Deflecting support to product. Add in-app FAQs, guided tours, smarter error states, and contextual tooltips so your team spends less time manually explaining the same flows.
- Stabilization sprints. Run a couple of post-launch sprints focused purely on bug clusters, performance hotspots, UX friction, and tech debt cleanup, with no new features. Fixing these early saves you from fire drills later.
The aim is a lean, stable baseline that costs less to run and is safer to build new features on.
Long-term budget management
Long-term budget management is about making sure the app’s finances age well over the years.
A simple playbook:
- Plan budgets in 12–18 month arcs. Split expected spend into four buckets: “run the app” (hosting, SaaS, maintenance, monitoring), “grow the app” (new features, experiments), “keep it healthy” (refactors, security, tech debt, dependency upgrades), and “invest in tooling” (developer experience, automation, internal tools, knowledge documentation).
- Re-forecast quarterly using real data. Compare planned vs. actual spend per phase and per epic. Use that to adjust future scope. The original spreadsheet is a starting point, due for revision as you learn.
- Tie major spend to milestones. Bigger investments (new platform, significant AI module, full redesign, regulatory cert) should be unlocked by hard milestones: revenue, retention, clinical adoption, or funding events. Define the triggers in advance, in numbers.
- Schedule renewal moments. Every 2–3 years, assume you’ll need at least partial re-architecture or UX modernization. Planning for that explicitly is cheaper than waking up to a stack no one wants to touch.
Long-term, the “cheapest” apps are the ones whose budgets stay boring and predictable, year after year.
App development financial planning guide
A simple money model for how you fund, justify, de-risk, and forecast the budget bands you’ve seen so far.
Funding options for app development
Before you argue whether your app is a $90k or $180k build, decide where that money actually comes from. Different funding paths tolerate wildly different risk profiles:
- Bootstrapping / internal budget. Best for $30k–$100k scoped MVPs where you can validate quickly and keep control. Pairs nicely with the lower complexity ranges in this guide.
- Friends & family / angels. Works when you have a clear story to a v1 and early traction but need more runway than personal savings can cover. Use the ranges here to anchor a realistic “use of funds” plan.
- Early-stage VC / accelerators. Makes sense only if the market and upside justify larger, multi-phase roadmaps (regulated healthcare, fintech, marketplaces, enterprise SaaS). Here, your app budget is a slice of a broader GTM plan.
- Strategic partners / customers. Design partners, anchor customers, hospitals, or large enterprises co-funding development in exchange for discounts, exclusivity, roadmap influence, or pilot data access. Slower to set up but can de-risk both funding and distribution.
- Non-dilutive options. Grants, loans, revenue-based financing, or strategic credits where you trade future cash for capital today while preserving equity. Best when you already see a path to revenue and want to keep equity intact.
Pick the funding mix before scoping features too aggressively. It’s easier to shrink a roadmap than to retrofit a realistic funding source to an overgrown one.
ROI calculation framework
“Is this app worth it?” needs a clearer answer than “we think users will love it.” Use a simple ROI lens on top of the cost ranges in this guide and the value discussion in Cost vs. Value Analysis and Advanced Feature ROI Analysis.
A pragmatic approach:
- Estimate annual upside. From your v1 scope, estimate either:
- Extra revenue (e.g., new subscriptions, higher LTV), or
- Cost savings (e.g., fewer support tickets, reduced manual work).
- Compute payback period.
- Payback (months) ≈ Total build cost / (monthly net benefit).
- If you’re spending $150k and realistically expect $15k/month in extra margin after ramp-up, you’re looking at ~10 months to break even.
- Sanity-check against runway. If the payback period is longer than your financial runway or patience, either:
- Cut scope,
- Raise more money,
- Revisit whether this is the right product bet, or
- Phase the build so early milestones unlock the rest.
- Iterate as you learn. Replace your estimates with real usage and revenue data post-launch. Update the payback math and re-decide whether to keep investing.
Use this framework to compare competing app ideas as well, especially when you’re tempted to skip the math on the one you’re already in love with.
Break-even analysis
Break-even is just ROI turned sideways: how many paying users (or transactions) do we need before this build stops being a pure cost?
A minimal process:
- Pick your unit of value. For SaaS, that’s usually monthly subscription margin. For marketplaces, take-rate per transaction. For internal tools, hours saved per month converted to dollars. For consumer apps, ad revenue per active user or in-app purchase ARPU.
- Set a target horizon. Many startups aim to recover initial build cost within 12–24 months of launch.
- Solve for users or volume.
- Break-even users ≈ Total build cost / (monthly margin per user × months to target).
- If you spend $120k, want payback in 18 months, and net $10/month per user, you need roughly 667 active paying users.
- Stress-test the numbers. What if monthly margin per user comes in 30% lower than expected? What if growth is half what you assumed? Run the math at pessimistic inputs to see how fragile your break-even point is.
Order-of-magnitude clarity is what matters. You want to know whether your break-even math lives in the realm of “hundreds,” “thousands,” “tens of thousands,” or “hundreds of thousands” of users, and whether your go-to-market plan can plausibly deliver that.
Investment risk assessment
$150k app bets land across a wide range. Some are “high odds, modest upside,” others are “moonshot or bust.” Read the cost bands in this guide through four risk lenses:
- Technical risk. New tech stack, heavy AI/ML, IoT, many integrations, or performance constraints. High technical risk → stay lean on v1 scope and favor proven components over greenfield invention.
- Market risk. Unproven demand, no pilots, no waitlist, or unclear pricing. When market risk is high, smaller MVPs and validation work earn the spend; bigger builds wait for proven demand.
- Regulatory/operational risk. PHI, fintech, payments, or workflows where failure has legal or safety consequences. Here, skimping on budget often just shifts cost into compliance fixes and firefighting.
- Funding/runway risk. If the app budget is more than 30–40% of your total available runway, iteration room shrinks fast. You’re betting the company on one product cycle.
Score each dimension (low/medium/high/critical). If you’re stacking “high” across multiple categories, your safest move is a tighter MVP in the lower cost bands, even if your long-term vision is much bigger.
Budget contingency planning
You already saw the advice in Budget Planning Best Practices to add 10–20% on top of your ideal number. Treat that buffer as safety rails for the unexpected. Spending it on features defeats the point.
A few rules of thumb:
- Reserve contingency primarily for refactors, infra changes, integration surprises, and security or compliance gaps. Treat feature creep as a separate scope decision.
- Release contingency gradually as you clear risk: after discovery, after first user tests, after beta, and after launch.
- If you burn through the buffer early, force a re-scope conversation before the budget quietly expands.
- Track contingency burn explicitly. If it’s spent, name what risk it covered. Keep that line item visible across the project.
Contingency is the price of dealing with unknowns without blowing up trust between founders, investors, the dev team, and operating stakeholders.
App development cost calculators
You may have come across app development cost calculators online, promising to give you an accurate estimate of your app development costs. But let’s face it: the variables in real app development make these tools unreliable.
Why?
- Variable blindness. Calculators miss the variables that actually shape the cost of developing an app: feature count, design depth, backend complexity, integration count, and post-launch support are just the starting set.
- Founder info gap. Most first-time founders need expert input to surface the specifics a calculator demands.
Manual cost estimation methods
If calculators are too blunt, build a quick manual estimate with numbers you actually control:
- Anchor to phases. Reuse the ranges from this guide (discovery, design, development, QA, deployment, maintenance) and decide whether your project will sit at the low, mid, high, or stretch end for each.
- Layer in feature complexity. Use the basic/advanced feature tables: count how many items you have in each bucket and sanity-check whether your planned budget can realistically cover that mix.
- Apply a blended rate. Multiply estimated hours (or cost bands) by a realistic blended hourly rate for your team model (onshore, near-shore, hybrid, offshore).
- Add a contingency. Top everything up by 10–20% for scope drift and unknowns. If you can’t afford that buffer, your “base” number is already too optimistic.
The goal is catching obviously impossible plans before you start calling vendors.
Cost comparison templates
Normalize all quotes into a single comparison sheet:
- Rows for phases/epics: discovery, design, development, QA, deployment, maintenance.
- Columns for scenarios: e.g., “Agency A (cross-platform MVP),” “Agency B (two native apps),” “Internal team,” or “De-scoped MVP.”
- Cell content: both cost and assumptions, including hours per phase, team composition, platform choice, and key integrations.
- Bottom row: totals, percentage breakdowns, gut-confidence score per scenario, and key risk flags.
Two simple checks:
- Does any quote show unrealistically low hours for development vs. your feature set?
- How much of the budget is going into non-negotiables (security, QA, infra, compliance) vs. nice-to-haves?
This turns “who’s cheapest?” into “which scenario makes the most sense for what we’re trying to prove?”
Budget tracking tools
Your estimate is only useful if you track reality against it:
- Start with a spreadsheet. Mirror the same phases/features you used for estimation and add columns for “planned vs. actual” hours/costs.
- Connect to your delivery tools. Pull time logs from whatever you’re using (Jira, Linear, ClickUp, Harvest, etc.) into the same sheet so you can see which epics are drifting.
- Review weekly. A simple weekly check-in (“which features are blowing past their band, and why?”) lets you de-scope or simplify while it still matters.
- Flag deltas above a threshold automatically. If a feature exceeds 120% of its estimate, trigger a re-scope conversation before the next sprint plans around it.
Over time, that sheet becomes your internal cost database for future projects.
Financial modeling resources
A cost estimate without a simple financial model is just a scary number.
At minimum, pair your app budget with a lightweight model that includes:
- Acquisition and activation: expected traffic, conversion to signups, conversion to paying users, and retention to month 3 or 6.
- Revenue per active user: subscription price, take rate, average order value, or ad revenue per active user.
- Runway and payback: how many months of runway your current funding buys at the planned burn, and what level of usage would pay back the initial build within a sensible window.
- Sensitivity scenarios: build “best case,” “expected case,” “pessimistic case,” and “stress test” sets of inputs for the variables above. The pessimistic and stress-test cases are what actually test your plan.
A spreadsheet with a handful of linked assumptions shows whether your app budget fits your business reality.
We’ve used our share of cost calculators over the years. Only the simplest projects ever stuck close to the calculated budget. Most deviated because the team pivoted on market feedback, or because the build adapted as new information came in.
Calculators give you a starting number. The build itself reshapes that number as new information comes in.
Future of app development costs 2025–2027
Over the next few years, app budgets stay sticky. How you spend will shift: more automation in build/QA, more spend on AI features and integrations, more pressure to justify every dollar with ROI, and more cost shifting into post-launch SaaS and inference bills.
AI impact on development costs
AI coding and testing tools will keep per-feature implementation cost drifting down, especially for boilerplate work and regression tests.
In practice, that saving is often reabsorbed by expanded scope: stakeholders ask for more platforms, richer analytics, AI-powered features, and deeper integrations for roughly the same budget.
Expect the biggest gains in maintenance and refactors (faster upgrades, migrations, test coverage, dependency upkeep), while complex, regulated, ML-heavy, or safety-critical work still commands senior rates and careful architecture.
No-code/low-code cost implications
No-code/low-code will increasingly absorb internal tools, admin panels, simple workflows, and quick-turn prototypes, cutting initial build costs for that slice by a large margin.
For external, user-facing products, these tools mostly move cost from “raw development” to architecture, integration, governance, and ongoing security review. Someone still has to:
- design data models
- secure PHI/PII
- wire in real APIs
- handle compliance attestations
Smart teams will use no-code/low-code for experiments and back-office, while keeping core product logic in a maintainable codebase.
Market rate predictions
Global average rates are likely to stay soft to flat in many regions as competition and AI tooling increase, but the top 10–20% of talent (strong product + engineering + domain + AI fluency) will remain expensive.
The onshore vs near-shore vs offshore price gaps should persist, with more teams normalizing on hybrid models:
- onshore product/architecture
- near-shore delivery pods
- offshore execution pods
- specialist contractors as needed
Project budgets will increasingly be driven by how disciplined the team is with scope and risk. Hourly rate is becoming a secondary factor.
Technology cost evolution
Infrastructure will keep getting cheaper at small/medium scale (serverless, managed databases, monitoring, edge networks), making early-stage run costs less of a budget bogeyman.
The new cost centers are AI APIs, data platforms, third-party SaaS, and observability stacks: usage-based pricing can quietly dominate long-term spend if you don’t watch it.
Tech stacks with fewer vendors and clear exit paths (owning core code, portable data) will age better financially than stacks that lean heavily on proprietary “black box” services.
How much does it cost to build your app with Topflight?
How much does it actually cost to build your app with Topflight? Honest answer: it depends on what you’re building. The complexity of your app drives the final price more than anything else we negotiate over.
For a basic MVP, you’re looking at costs in the ballpark of $70,000 to $150,000. For more complex builds integrating components like cloud services, EHR integrations, IoT integrations, or ML/AI technology, the cost can climb to $200,000 or more. We also work on prototypes for promising products that sometimes start at $40,000-$50,000.
Small business app examples
For small businesses, we’ve shipped focused apps like Goodskin’s med spa treatment planner and JOOVV’s BLE-connected light therapy companion, where the phone controls pro-grade devices used at home and by teams like the San Francisco 49ers, JOOVV’s official light therapy partner.
These projects sit in the lower-to-middle MVP bands quoted earlier: serious builds, tightly scoped around one hero workflow.
Enterprise app case studies
Walker Tracker grew from a step-challenge app into a full corporate wellness platform, then was acquired by Terryberry in April 2022 and folded into their global engagement suite.
On the clinical side, GaleAI (a medical coding automation platform we built with complex Athena EHR integration) identified a 7.9% undercoding rate in a one-month retrospective audit and an estimated $1.14M in yearly lost revenue. The cost was less than 1% of the recovered revenue.
That’s the pattern for enterprise work: higher upfront cost, but explicitly aimed at outcomes like acquisition, global rollouts, multi-year revenue-expanding contracts, and platform-level deals.
Startup success stories
SoberBuddy is an evidence-based virtual recovery coach chatbot we rebuilt from a fragile prototype into a commercial app with 100,000+ downloads and strong subscription/retention metrics (9%/58%).
This is the startup sweet spot: one well-executed v1 that proves engagement and monetization, then justifies further product and fundraising rounds.
Cost vs. outcome analysis
- AlgoRX: medication storefront built on our stack → 12× ROI, with $1M+ in sales by month 2 driving 7-figure ARR within ~6 months.
- Dedica Health: RPM platform for a cardiology group → anchored by a $300,000 ARR SaaS deal, the platform now monitors 1,100+ patients daily, with >80% hitting CPT targets.
In both cases, the dev spend looks small next to the recurring revenue and defensible workflows those apps now run.
Why Topflight is the cost-smart partner for app development
Most “budget overruns” come from the same place: hours lost reinventing basics. Topflight tackles cost head-on by breaking every estimate into design, technical build, QA, and maintenance buckets (the same four drivers highlighted earlier in this guide), so nothing hides in the fine print.
That discipline shows up in the numbers:
- Allheartz MVP in 800 hours over 6 months. Computer-vision rehab that cut in-person visits 50% and clerical work 80%.
- RTHM MVP in ~1,400 hours. No-code/low-code Long-COVID platform that shipped faster by re-using ready-made modules.
- GaleAI MVP in 1,100 hours. AI medical-coding SaaS now lifting provider revenue up to 15%.
Those speed-to-market wins helped founders across our portfolio raise $188M+ in follow-on funding, proving investors like the cost curve too.
What keeps the budget on track
- Cross-platform codebases. React & React Native cut build spend 40–50% versus separate native teams.
- Reusable HIPAA-ready modules. Auth, chat, EHR hooks, and analytics snap in fast inside a single sprint.
- Agile, sprint-size planning. Two-week sprints with burn-down metrics flag scope creep before it eats cash.
- Compliance baked in. HIPAA, SOC 2, PKCE, and audit logging from day one. Audit prep stays simple.
Need to know more about app costs?
There you have it: the breakdown of app development costs. The price of your app will end up between $80,000 and $150,000, with 25% of the initial budget going toward yearly maintenance.
We’re app developers in NYC, LA, Miami, and our team is here to help. The FAQs below cover the most common questions about app development costs. Reach out for anything else. Our team will share insights to help you ship on time, on budget, on scope, and with a clear plan for what comes after launch.
Related Articles:
- How much does app design cost
- Healthcare App Development Cost Breakdown
- How long does it take to develop an app
- Telemedicine App Development Cost
- Cost of AI in Healthcare
- Cost of EHR Implementation
[Originally published in July 2017. Updated periodically since.]
Frequently asked questions
How much does mobile app development cost?
The average app costs US $80,000 to $150,000 to develop, for medium complexity.
How much does it cost to maintain a mobile app?
Roughly 25 percent of the total app development cost per year.
How long does it take to build an app?
Three to six months, depending on team composition.
Is cross-platform app development really less expensive than building apps natively?
Yes. If your app fits the cross-platform sweet spot, you’ll spend significantly less than building two native apps separately.
What are shortcuts to optimizing my app development budget?
Work with a developer who knows the current SDK ecosystem. They’ll point you toward ready-made components and frameworks that cut weeks off development and save budget.
How much does it cost to make an app if I use Flutter or React Native?
Flutter or React Native typically save 25-35% of the budget compared to building two separate native apps.