
Imagine you’ve stumbled upon a lovely budget tracking app. Everything goes well until another update breaks a forecasting feature you’ve enjoyed the most. The report opens at random, despite you rage-tapping a button a thousand times.
Finally, when you are ready to ditch the app, a notification arrives, urging you to update and check out the overhauled forecasting option. How do they know? Easy, the app owner pays attention to mobile app analytics metrics.
Key Takeaways:
- Out of 100 mobile app KPIs it’s enough to track 10 that affect your app success the most.
- Attribution tracking platforms are indispensable in assessing mobile app metrics reflecting user traffic sources.
- It’s OK to start measuring mobile app analytics metrics with the developer tools provided by Apple and Google natively. Then switch to custom SDKs when the app gains enough traction.
- Besides app marketing KPIs it’s critical that you gauge application performance metrics. In other words, you need to know how often and when the app breaks.
- If you don’t have the resources to watch multiple app metrics, we recommend that you track at least user retention.
Read on to learn what mobile app metrics to track if you want to set up your app for success by observing and analyzing your customers’ behavior.
- What are Mobile App Metrics and KPIs?
- Acquisition App KPIs: Will Users Download your App?
- Engagement App KPIs: Do Users Stick Around?
- App Revenue Metrics: Does the App Turn a Profit?
- Mobile App Marketing KPIs: Are Your Marketers Doing a Good Job?
- Mobile App Performance Metrics: How Did Your Developers Do?
- The Most Painful App KPIs to Track
- Extra App Metrics to Track
- Top 5 Mobile App Metrics Tools
- Best Practices for App KPIs Tracking
- Our Experience in Mobile App Analytics
What are Mobile App Metrics and KPIs?
What are key mobile application performance metrics, aka app metrics, aka mobile app KPIs?
Definition
Plainly speaking, Mobile App KPI is everything we can track about user interactions with an application.
Back in the days when the app stores just opened, we could barely track anything besides downloads and purchases. Life was easy. Today, business owners can choose from 50 to 100 mobile KPIs to track.

Obviously, it would take a book to go through all of these, but today we’ll talk about those that really matter when custom developing your mobile app, and after.
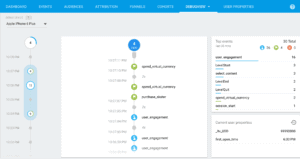
Where do we track these metrics?
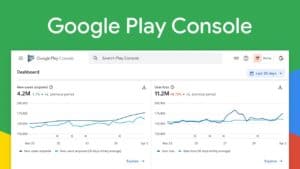
Right before we jump into discussing different key metrics for apps, we should probably mention where we can track these KPIs. Apple and Google will provide you with the basics via iTunes Connect (for iOS) and Google Play Console (for Android).
Using the data from iTunes Connect and Console, we can run simple calculations to determine the critical metrics for apps. And as for more advanced stuff, there are plenty of app analytics tools on the market, including Google Analytics, Mixpanel, UXCam, etc. We’ll discuss them in more detail below.
But right now, let’s talk about the KPIs we need to track.
Acquisition App KPIs: Will Users Download your App?
An app’s life starts with people noticing it in an app store as it sits right next to the other 2-3 million apps. What KPIs do we want to track to check if people are even going to notice our product?
Downloads aka Installs
Last time I checked, we can’t download an app without immediately installing it. So what we count here is how many installs we have. An install (or a download; we’ll use the terms here as synonyms) is a new user. Therefore, the more installs we get, the better.
Note that Apple counts all redownloads or Family Account downloads towards the total number of installs (and they call those app units). We advise you to check with your analytics service provider on how they track downloads to avoid discrepancies.
Formula
Downloads are downloads; there’s no need to count anything. Just check the numbers in your iTunes Connect/ Google Console dashboard or any other tool you have for analyzing app statistics.
Example
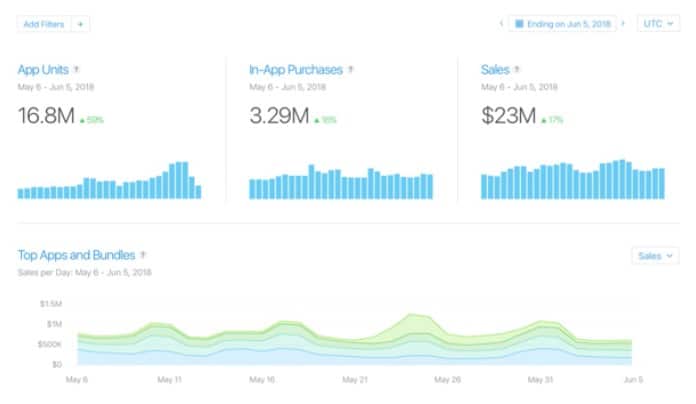
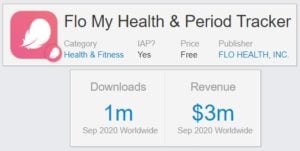
Here are a few reference apps to give you a ballpark picture:
- #1 in Health & Fitness (Apple)
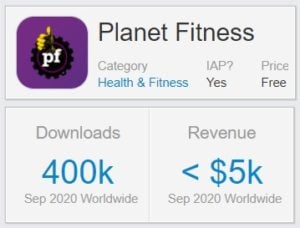
- #10 inHealth & Fitness (Apple)
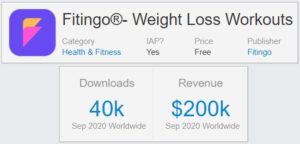
- #100 in Health & Fitness (Apple)
Related: How to Build a Winning Fitness App
Benchmarks
As you’d imagine, the number of downloads will depend on how well the solution ranks in the app store. There’s no benchmark here, really: the more, the better. If you get more than 1000 downloads per day, it’s your chance to get into the top 100 apps in your category.
Install Rate
At the same time, you might want to estimate how many of those who discover your app actually download (read install) it: app install rate. Please do not confuse the conversion rate that describes the percentage of people who install the product from an app store page.
Formula

Example
Let’s say 100 people have stumbled upon your doctor’s appointment booking app (either when searching or casually browsing through a store) or landed on its page straight from an ad. Of those 100 users, 20 decided to give it a try and installed the app. In this case, the install rate is:
20 (downloads) / 100 (impressions) x 100 = 20% (Install Rate)
Benchmarks
According to various sources, the average install rate for health & fitness categories is around 5%.
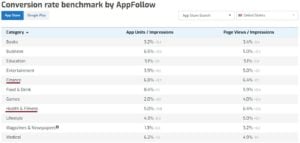
As for financial apps, the average install rate is around 7-8%. At Topflight, we mostly deal with healthcare and fintech, but if you’d like to find more reference points for your product, please check the app conversion rates for Apple and Google here.
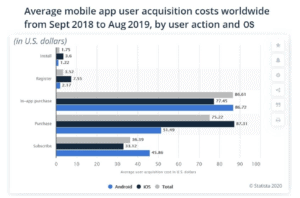
Add-on user acquisition metrics
What’s great about these additional metrics is you don’t need to count them:
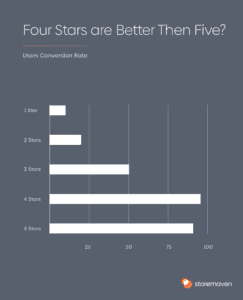
- App Rating
The rating can be 0 to 5 stars. According to Storemaven, anything higher than 4 stars gets you more downloads:
- App Reviews
App review is not necessarily something your user will see. Plus, you’re already taking care of it if you work on your ratings. Just make sure that you have enough above-average recent user reviews.
- Category Ranking
Well, this one is self-explanatory. When you reach the top charts, downloads start pouring in.
- Keywords
Some app metric tools will let you track the keywords people use to find your solution. With that feature, you can optimize your app store card’s description and title to increase its visibility.
- User attribution
This last acquisition metric is fundamental. Such tools as Adjust or AppsFlyer will let you see where new installs are coming from, so you know your best RIO options for pouring investments.

Engagement App KPIs: Do Users Stick Around?
Here’s the list of all app engagement metrics we’ll review:
If you’ve read this far, you already know what metrics you need to focus on to keep new users coming.
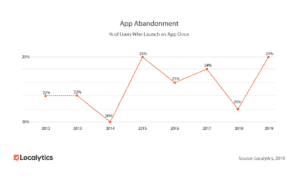
Now let’s talk about what we need for them to stick around because the latest stats are somewhat frightening:
25% of all downloaded apps worldwide are used only once
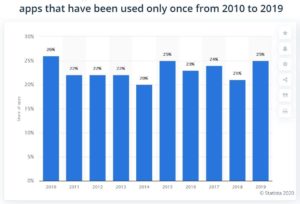
So we really want to see the stats that show how our application is doing in terms of keeping users engaged.
DAU/WAU/MAU/ADAU — Active users per time interval
DAU — daily active users
WAU — weekly active users
MAU — monthly active users
ADAU — average daily active users
How many users launch your app on a daily/weekly/monthly basis? We should pick one metric that makes the most sense to our business.
If our app reminds patients to take a pill, then DAU monitoring is a must. If it’s a budgeting solution, WAU or MAU will do most of the time.
Note that different platforms count active users in different ways. Some take into account meaningful actions like starting an app and adding a task or viewing a report at least for a couple of seconds. Others count absolutely everything, even accidental launches.
Formula
There’s no real formula, just the count of all users who launch your product at least once within a set period. Remember, if the number is growing, you’re getting more users to your application, and if it’s falling, you’re losing them.
Benchmarks
It used to be that if your app’s DAU/MAU was around 50%, you could consider yourself lucky — almost on a par with Facebook. Today’s solutions hardly reach 20% of the DAU/MAU ratio, which is regarded as a standard. According to Apptopia, the average DAU of healthcare & fitness applications in the Americas in 2020 is 9.41%.
Retention rate
The retention rate is the percentage of people we retain over a set time. Since it’s our product, we get to decide that period: do we want users to keep coming back to the app every day, week, or month?
What’s important here is to keep them coming back at all.
Formula
The most commonly used method for calculating the application retention rate is:
Retention Rate = (# of customers at the end of a period – # of new customers during that period) / # of customers at the start of the period x 100.

Example
Let’s say you have:
- 200 users at the beginning of November
- 310 users at the end of November
- 150 of these 310 users are newcomers
The retention rate equation would look like this:
((310-150) / 200) x 100 = 80% (Retention Rate)
Benchmarks
Research shows that the average retention rate in the mobile space varies between 30 and 40% tracked over 30 days and stays around 25% by the 90th day.
Churn rate
Churn is the opposite of retention. That’s all users who stop using the application. Therefore, keeping this number down is critical to your app’s success.
Formula
You always want to calculate the churn rate for a given time period, usually a month:
Monthly Churn Rate = # of users lost during this month / (# of users at the start of the month + # of new users during this month) x 100

Example
If our fictional mental health solution:
- had 45,300 users at the start of November
- acquired 5,000 users during November
- lost 2,100 customers during the same month
the calculation would look like this:
2,100 / (45,300 + 2,100) x 100 = 4.4% (Churn Rate)
Benchmarks
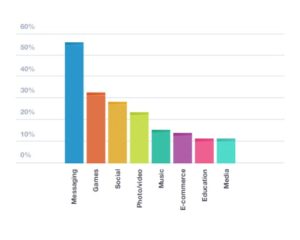
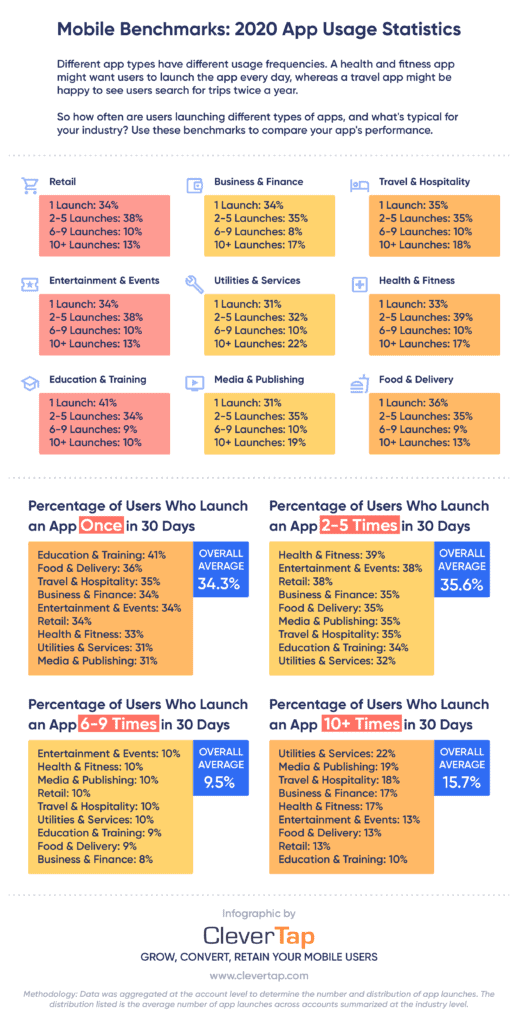
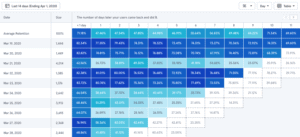
There’s no industry benchmark. Just try to keep it as low as possible. You can also refer to this chart by CleverTap to align your expectations on how often users will start your app:
Stickiness aka App Open Rate (AOR)
This metric shows the percentage of users who find your product appealing enough and stick around continuing to play with it for a set period of time. We can also define it as the number of monthly active users who stay around long enough to become daily active users.
However, keep in mind that you can use different time intervals that make more sense for your business.
Formula

Example
Let’s say you have:
- 100 MAU
- 40 DAU
Then your equation for calculating stickiness would look like this:
40 (DAU) /100 (MAU) x 100 = 40% (App Stickiness)
Benchmarks
Of course, a remote patient monitoring application would have different stickiness KPI measurements than a real estate mobile product simply because of their very nature. Still, if you’re looking for the industry benchmark, it’s around 24%.

As with any other app metric, we recommend that you stick with your own criteria and compare the stickiness KPI with your previous results.
Other reads:
- How to develop a stock trading application
- Building a blockchain app
- Machine Learning App Development: All the Hows and Whys
- Healthcare App Development Guide
Time to First Purchase
Suppose we provide in-app purchases, subscriptions, or e-commerce. In that case, we should absolutely track how long it takes on average for the user to make a transaction. We might even track the time between several consecutive transactions if we have several in-app purchase options.
Formula
There’s no formula, just the time from the first time a customer launches our mobile solution to their first transaction.
Example
Let’s say a Tinder user has played with the app for two weeks and then bought Tinder Gold. The time to first purchase is 14 days.
Benchmarks
There’s no real industry benchmark for how long it takes customers to make the first purchase, but the most popular free trials last for two weeks or a month.
Goals and app events tracking
These metrics show what percentage of customers follow the user paths you laid down for them so they can reach their goals.
Formula
![]()
Example
Let’s say your budgeting app has an onboarding how-to screen that users can click-through one by one or cancel at once. The goal you’ve defined is to scroll through all the how-to screens.
You onboarded 327 users in November, and 24 of them scrolled through all the welcome screens, while others chose to skip the tutorial. You goals equation would look like this then:
24 / 327 x 100 = 7% (Goals)
(which is a good indicator in favor of cutting the tutorial and making it available from the menu)
Benchmarks
Obviously, no benchmark here. Instead, see if your customers have success following your user journeys and seek ways to improve their flow.
Sessions
You can also track user engagement by checking a bunch of metrics that have to do with how often customers run the application and how long they stay in it once launched:
- Number of sessions
How many times your app is launched during a set period.
- Session length, aka time spent
How long users stay in your solution once they’ve launched it.
- Session depth aka average screens per visit
How many screens people visit after launching an app
- Session Intervals
How long the app sits idle between launches by the same customer.
- Most active days, time of the day
These KPIs help you spot the most active time intervals for your users.
App Revenue Metrics: Does the App Turn a Profit?
Once we are tracking everything concerning user engagement, it’s time to start focusing on the revenue. After all, the mobile product exists to support our business model and bring profits, right?
What KPIs do we need to monitor concerning its profitability?
Average Revenue per User (ARPU)
The first metric you want to track is how much an average user adds to the bottom line. This KPI is usually calculated for a certain period, e.g., for a month. Knowing ARPU can help us understand if we should charge more to meet our financial goals.
On the other hand, ARPU will remain pretty consistent for subscription-based apps, making this metric less relevant for the overall picture of app analytics.
Formula
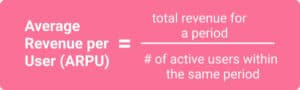
Example
Let’s say your stock and crypto trading application:
- had 4,500 MAU (monthly active users) in November
- generated $16,000 in November
Then your ARPU would count as follows:
$16,000 (revenue) / 4,500 (MAU) = $3.55 (ARPU)
Benchmarks
While ARPU may vary significantly across different applications, it’s worth noting that apps with a subscription monetization model generate higher ARPU than freemium and paid ones. In 2013, subscription-based apps were raking in $0.11 monthly ARPU vs. $0.04 for freemium.
Customer Lifetime Value (CLTV)
When you have an average revenue per user, it’s easy to count what revenue each customer brings in while using your mobile application. It’s the CLTV that allows you to project future revenue based on the number of new users.
Formula

Example
Let’s take the ARPU we already calculated above ($3.55) and use it to calculate the CLTV for the same trading app (knowing that customers on average leave after 8 months):
$3.55 (ARPU) x 8 months = $28.4 (CLTV)
Benchmarks
There’s no industry standard for the mobile CLTV metric. However, as long as it’s higher than what you invest in acquiring new users and other app-related costs from app development costs to maintenance, you’re on the right track.

Total conversions
Conversions are what percentage of your users perform the desired action or actions. It doesn’t always have to be a revenue-related metric as you may be counting users who submit their health data in a medical application.
However, the most common scenario is to find out how many users subscribe or make in-app purchases during a set interval.
Formula
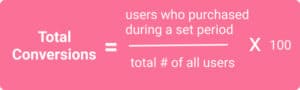
Example
Imagine we have:
- 4689 users, overall
- and 1834 of them made an in-app purchase in November
Then the November conversion rate would count as:
1834 / 4689 x 100 = 39% (Total Conversions)
Benchmarks
The conversion rate varies from app to app. It depends on too many factors to draw up an average for the whole mobile industry. According to Clevertap, though, the number is 1-2%.
Average order value
This metric is super useful for e-commerce solutions where you might want to know the price of the average order. As with many other metrics, we always want to know this KPI for a specific time interval.
Formula

Example
Let’s say that your revenue in November was $16,900, and customers made 3,482 purchases all in all. Then we count the average order value as:
$16,900 (revenue) / 3482 (purchases) = $4.85 (Average Order Value)
Benchmarks
This metric is obviously different for each application and depends on the subscription or in-app purchases.
Mobile App Marketing KPIs: Are Your Marketers Doing a Good Job?
By now, we’ve already successfully acquired, engaged, and started monetizing our users. Now is the time to double-down and match our marketing expenses against profits. Eventually, we’ll be able to identify new growth points and check our marketing performance.
Customer acquisition cost (CAC)
The first thing you want to know about app marketing KPIs is what you’re paying to acquire new users. This includes all marketing and sales activities that lead to obtaining new customers.
What’s essential with the CAC metric is to define your conversion. Typically, that’s either an installation (has to do with app download metrics), registration, or purchase/subscription. Of course, you can track those conversions individually too.
Formula
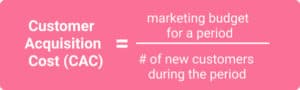
Example
Let’s say you spent $8,000 on a marketing campaign in November and, as a result, got 234 new customers. The calculation of CAC looks as follows:
$8,000 (marketing budget) / 234 (customers) = $34 (CAC)
Benchmarks
Companies pay around $4 to get a new customer who installs and registers in the mobile product.
Paid/Organic Conversion rate
This mobile app metric goes hand in hand with attribution. It describes how well our application converts users that came from ads as opposed to users who discovered the product on their own.
This KPI follows the same formula as CAC and doesn’t provide a benchmark.
Mobile App Performance Metrics: How Did Your Developers Do?
As people continue using our solution, we shouldn’t ignore another huge aspect of our application’s well-being, and that’s app performance. Do customers get a smooth experience they’ve come to expect from a mobile solution, or do they have to deal with glitches and bugs due to insufficient mobile app QA?
In other words, did app developers do a good job?
You might wonder, “How to measure an app’s performance?” What’s great about mobile app performance KPIs is you never count them yourself. That would be overkill. Instead, there are special tools that meticulously track all types of events inside your application:
Crashes
How many crashes happen, where they occur, and other relevant data. The average crash rate for mobile solutions is around 1.5%.
Startup time
How long does it take for the app to launch? Anything between 1 and 3 seconds should work fine.
Screen rendering time
How long does it take for a mobile solution to display some data, whether it’s text, images, or both? The faster our application renders the screens, the less stutter customers experience using it.
Memory/battery/data plan usage
We all make revisions of our apps from time to time. Which ones go first? I bet we all delete those we use least often and those taking up too much space and draining the battery and sometimes bandwidth usage.
Device type, mobile OS, screen size, etc.
This metadata compliments bugs, crashes, and other anomalies in app performance indicators.
API responsiveness
Since our mobile product needs to sync data with a server or fetch it from various places on the internet, we need to ensure that the solution remains responsive even on slow connections.

The Most Painful App KPIs to Track
In a perfect world, users never leave your application and come back to it regularly to complete their goals. However, life is life, and we do end up uninstalling apps when they cease to fulfill our needs. That’s why we must track these unfortunate app metrics too.
Drop-off rate aka exit rate
We need to know what screens cause customers to leave the product. Remember that it’s not necessarily an issue if customers are leaving the application from, let’s say, an order confirmation screen. This merely means they’ve successfully achieved their goal and went about their daily routines.
Of course, it’s an entirely different story when that happens in the middle of a user journey. And we need to look for any roadblocks that may cause users to leave the solution.
Abandonment rate aka uninstalls
What’s worse is when users uninstall our mobile product. We can track that using app analytics software that we’ll review in a second. With their help, we can reach out to users who deleted the mobile solution and try to win them back.
Extra App Metrics to Track
Finally, when you think we’re tracking everything possible, there are still plenty of KPIs to entertain yourself. And while they do seem quite exciting, their utility in adjusting an application for further growth certainly raises questions. In other words, it’s very individual from app to app. Tracking performance for smart watch app development ensures that wearable features, like notifications and engagement metrics, are accurately monitored and optimized.
Click-through rate (CTR) aka notification open rate
The click-through rate shows the percentage of users who open push notifications. The metric lets you see how engaging your messaging is.
Besides tracking the open rate, some application analytics services also allow you to track the number of dismissed push notifications.
Formula

Example
A total of 569 users got a push notification about a discount on subscription in your application, and 498 of them opened the notification. The notification open rate would look like this:
498 / 569 x 100 = 88% (CTR)
Benchmarks
According to one research into 300 billion notifications, health apps get on average a 2% open rate and fintech — 3%.
App permissions tracking
If your application needs permissions to offer such features as location tracking, audio recording, or text messages parsing, you may want to track if users are allowing these or not. As a result, you may discover if you need to adjust your in-app prompts to explain why the solution needs access to certain iPhone features.
Touch heatmaps
Touch heatmaps may seem a little fancy, but we still have to mention them. This metric shows you where users tap, swipe, etc. most of all. Equipped with this knowledge, you can then optimize the UX.
For example, if a heatmap tells you that users rarely visit Profile, you could move it to the settings and surface another more popular section for your customers.

Social shares
How many Facebook likes, Twitter reposts, etc. the app is enjoying. I’d say a totally vanity metric unless we’re dealing with a mobile product of the TikTok scale.
Top 5 Mobile App Metrics Tools
At this point, we are tracking a bunch of stuff, and I bet you’re thinking, “How do we track all of these?”. Fortunately, there’s no shortage of application metric tools on the market: G2 has 52 app KPI measuring tools on its list.
The way it often works is you:
- Add a tool’s SDK to your application
- Get access to a web dashboard with reports
Types of app metric tools
Here’s a list of popular application analytics SDKs based on analysis of Android apps in September 2020:
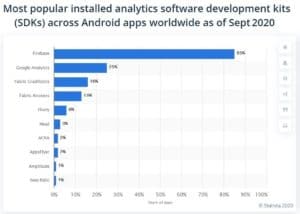
While many of these solutions tend to offer a mixture of parameters on app performance and usage, we can still divide them into distinct categories based on the priority they give to individual application KPIs.
Let’s draw up a list of categories for app metric platforms and quickly review the most prominent tool in each category.
Traditional marketing app KPI-measuring platforms
If we need to focus on things like DAU, Retention, Churn, CLTV, CAC, etc., we should turn to these traditional metric-tracking platforms.
Popular tools: Mixpanel, Pendo, Adobe Analytics, CleverTap, Flurry, Google Analytics.
![]()
Top marketing app metric tool: Mixpanel.
Mixpanel has an impressive array of options for tracking mobile app usage metrics without complicating the process. The company serves such brands as Uber, Twitter, and many others.
Founded: 2009
Notable features:
- complete customer journey tracking
- anomaly analysis of data
- cross-platform push notifications

Attribution platforms
These app tracking platforms focus on identifying the source of traffic. Using their SDKs, we can understand what sites, ads, etc. brings us the most users.
Popular tools: Branch, AppsFlyer, Adjust, Kochava.

Top attribution app metric tool: AppsFlyer
AppsFlyer’s main feature is attributing user acquisition so that your marketing team can optimize the marketing budget. The tool also provides stats on retention metrics for apps along with cohort analysis.
Founded: 2011
Notable features:
- multi-touch attribution
- retargeting attribution
- configurable attribution windows
Performance tracking solutions
These tools concentrate on tracking issues, such as crashes, unresponsiveness, etc. within applications, creating detailed logs.
Popular tools: Sentry, Embrace, Crashlytics, HockeyApp, Instabug.
![]()
Top app performance tracking tool: Crashlytics.
Crashlytics is part of Firebase, Google’s suite of applications that you can deploy as an off-the-shelf app’s backend.
Founded: 2011
Notable features:
- breadcrumbs powered by Google Analytics to reproduce crashes faster
- real-time notifications about new crashes
- crash insights to track down root causes
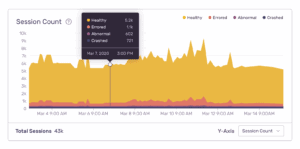
Session-recording analytics like Smartlook and UXCam
Smartlook and UXCam are rather new app analytics platforms (founded in 2016 and 2013, respectively) that record videos of how customers use your mobile product. They also provide funnel and event analytics.
Popular tools: SmartLook and UXCam

Top session-recording analytics tool: UXCam.
Notable features:
- heatmaps
- automatic rage-tap tracking
- user segmentation
Market intelligence platforms
Tools like App Annie help you get a sense of what is happening in the market and how your competitors rank. In addition, these tools allow you to track your app monetization and performance.
Popular tools: App Annie, Sensor Tower, Appfigures, App Radar.

Top app performance tracking tool: App Annie.
App Annie was one of the first companies to offer app owners insights into the app market, advertising-related analytics, and tracking of all popular mobile application metrics — all in one place.
Founded: 2010.
Notable features:
- anonymized and aggregated data from over 1 million applications
- continuous innovation of the platform (introduced GameIQ recently)
- ranking charts, historical data, and international app store matrices
Best Practices for App KPIs Tracking
There are also a few best practices that you should remember when tracking KPIs for an application.
- All app metric monitoring tools have different recipes for tracking various metrics
Get to know how exactly they track the metrics that matter to you and ensure you can customize those if necessary.
- You can track a lot (for free) in Apple’s and Google’s developer accounts
Definitely check if the basic stuff that App Store Connect and App Console provide will be enough for getting you started on the app tracking and optimization track.
- Use your own data warehouse to collect all necessary data from your app instead of adding SDKs
That may work if you want to use several SDKs from competing metric tracking tools, which may slow down your app. As an alternative, your own data warehouse may connect to these platforms and feed data directly into them without downgrading an app’s user experience.
- Always use cohort analysis to pull insights that will matter for your app
Reverting to a cohort, or plainly speaking, a group analysis, you ensure that the metrics you collect help you create a meaningful picture of how users interact with the app in reality. For instance, you might want to track users from Facebook separately from users coming from an app referral program.
- Limit the things you track in the app performance dashboard to preserve the top-notch user experience
The more logs you gather and send, the more prominent will be the effect on the bandwidth and app performance in general. So remember that bigger is not always better. Instead, focus on the KPIs that matter to you.
Our Experience in Mobile App Analytics
At Topflight Apps, we love working with Firebase and Google Analytics to help you track user goals and analyze app usage in general. That approach allows us to remove any bottlenecks that might hinder user journeys inside the app.
We also love using new tools when we see the real benefit to your business. One of the recent projects we completed involved the development of a chatbot for people with addictions. Keeping in mind the monetization goal, we integrated the app with RevenueCat.

The tool enabled in-app subscriptions and provided that chatbot’s co-founders with insights into purchases and other in-app data across iOS and Android.
Another app metric tool that played a vital role in this project was Sentry. Since we took over the chatbot from a previous team who struggled with making it a top-notch experience, we had to deal with lots of bugs. Sentry helped us quickly identify crashes (in real time) and track down their causes.
Related Articles:
[This blog was first published in November 2020, and has been updated for more recent data]
Frequently Asked Questions
If I want to monitor a single metric, which do you recommend I focus on?
Retention, on the condition that you identify meaningful criteria in terms of how often you expect customers to use the app. Knowing how many customers you retain is crucial to understanding whether your business is growing or stagnating and should be given priority over all other key performance indicators.
What if I want to implement different KPI gathering tools? Will it work?
Yes, there’s no problem integrating a few SDKs from competing app metric platforms into your app. However, there’s a chance they may slow down the app. We would double-check if you can get away with fewer SDKs or if it makes more sense to develop your own cloud data silo to feed data from there out to different tracking platforms (they need to support that option too).
Is it possible to add KPI tracking tools into an existing application, or is it something that needs to be architected when developing a mobile solution?
Both variants work; less effort required if you envision that at the architecture level, though
What is cohort analysis?
It’s tracking various key metrics for apps related to specific user groups (cohorts). That’s important if you want to better understand customer behavior within a particular group, e.g., how many conversions you got from the users that came from Twitter last month.