
Today, it’s hard to imagine an app without a dashboard. They have become ubiquitous. They have even made it into settings on our phones in the form of visualizations of device maintenance and battery usage.
 But if it used to be “let’s throw in a data console here to make the management happy,” developing a web dashboard app in the present day and age is very different and challenging. In this blog, we’ve stacked together everything you need to know to develop an engaging and effective dashboard web app.
Table of Contents
1. Differences Between Dashboard and Report
- What is a Web Dashboard?
- What is a Report?
- Visuals vs. Text
- Conciseness vs. Longevity
- CEO vs. Employees
- Dynamic vs. Static
2. Reasons Why You Need a Dashboard Web Application
3. Out-of-the-box Solutions vs. Custom Development
4. Top 3 Out-of-the-box and SaaS Solutions
5. How to Make a Custom Dashboard Website?
- Step 1: Find a product-market fit
- Step 2: Design
- Step 3: Review available tools
- Step 4: QA
- Step 5: Deploy and Maintain
6. How Much Does It Cost to Create Your Own Web Dashboard?
7. Our Experience in Dashboard Web Application Development
8. It’s Time to Create a Web Dashboard
Differences between Dashboard and Report
You can often hear the terms used interchangeably in organizations, e.g., when someone asks where they can look up the information they are looking for, and a colleague refers them to a dashboard or report.
And I’m sure you kind of already feel the difference between these two, but let’s draw the line and help you understand the peculiarities of dashboards and reports. That way, you’ll know if you want to build a web based dashboard or reports.
 What is a Web Dashboard?
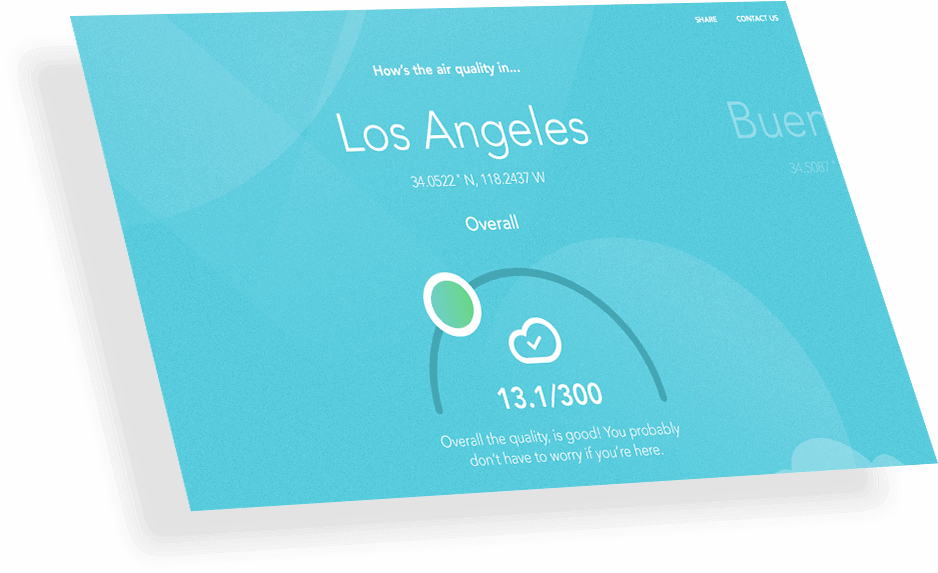
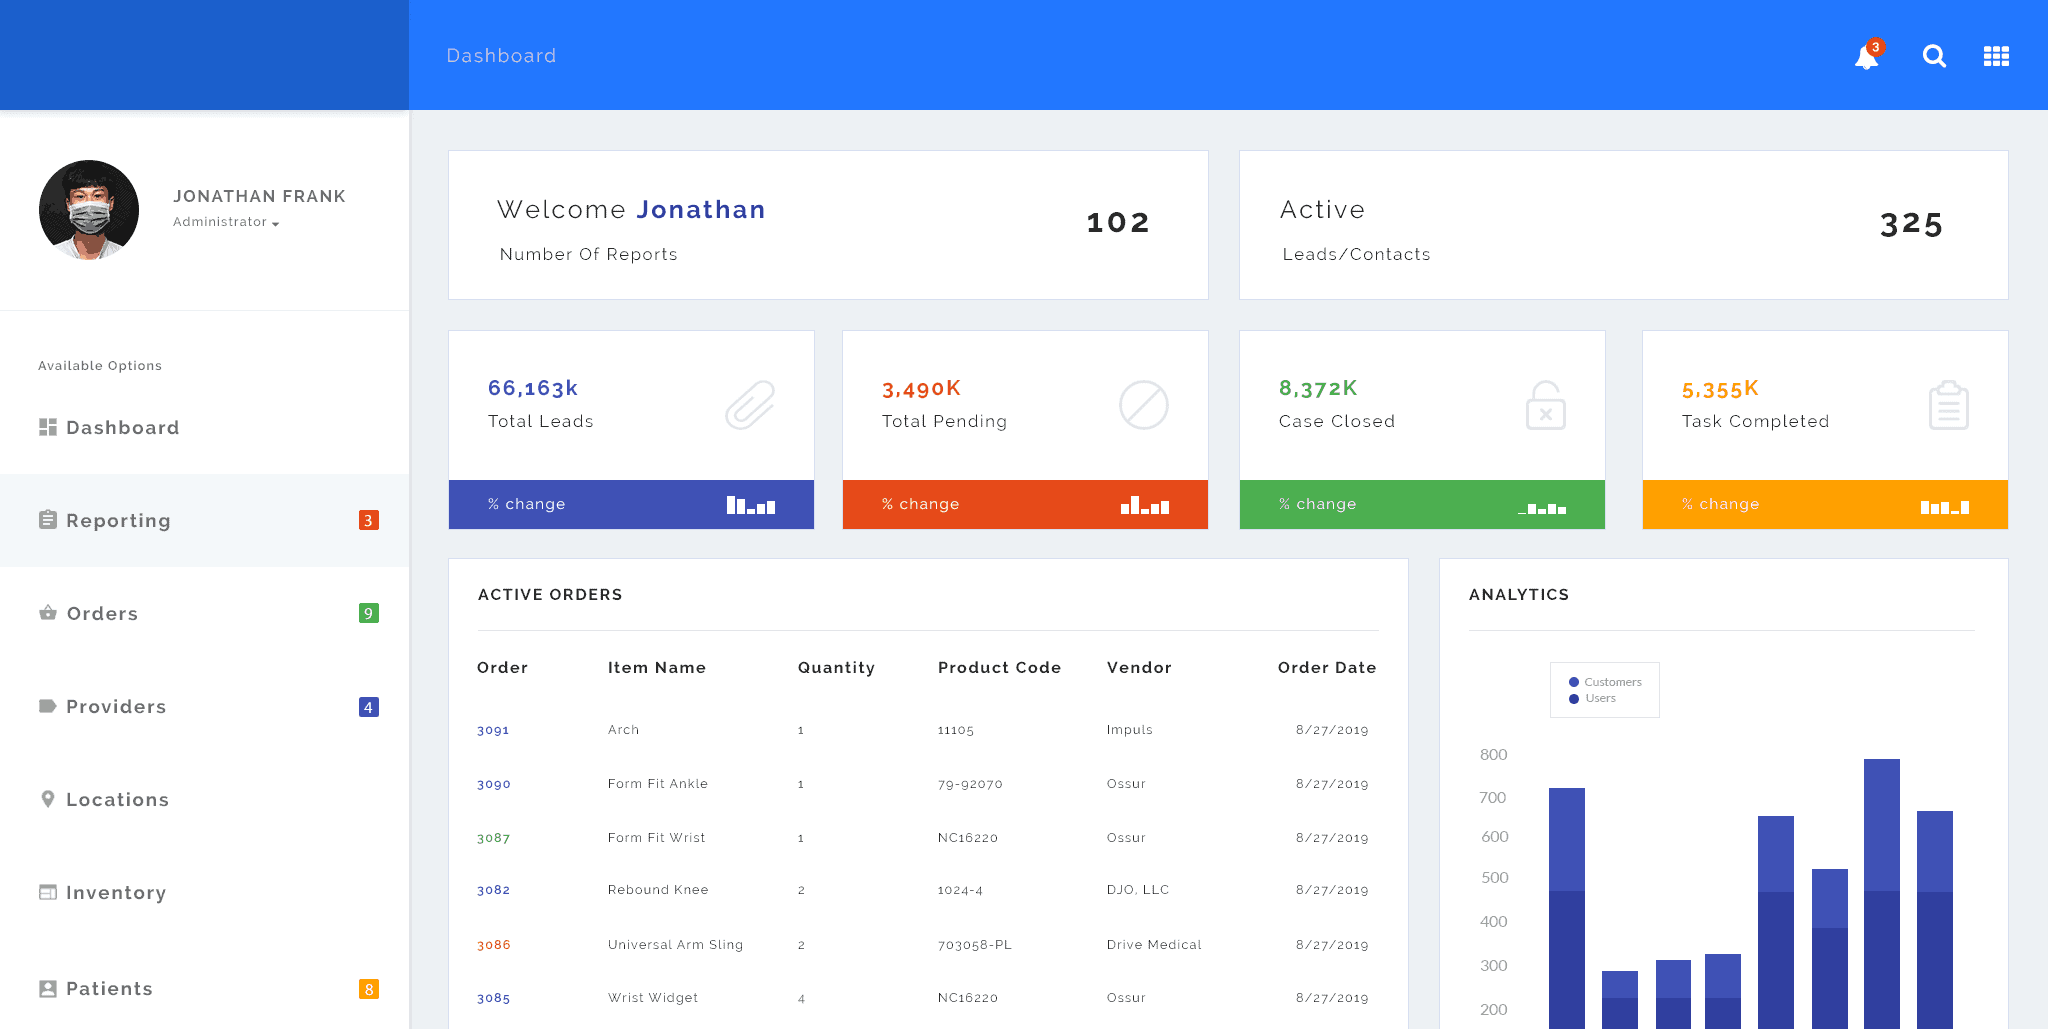
In the software realm, a dashboard is a visual, at-a-glance representation of key data points. That’s it. If your company is selling medical equipment and your web app shows you a chart with the top 10 selling items for the last month — that’s a dashboard right there.
The key metric of whether you’ve succeeded is what fraction of your employees use that dashboard every day.
Keith Rabois
What is a Report?
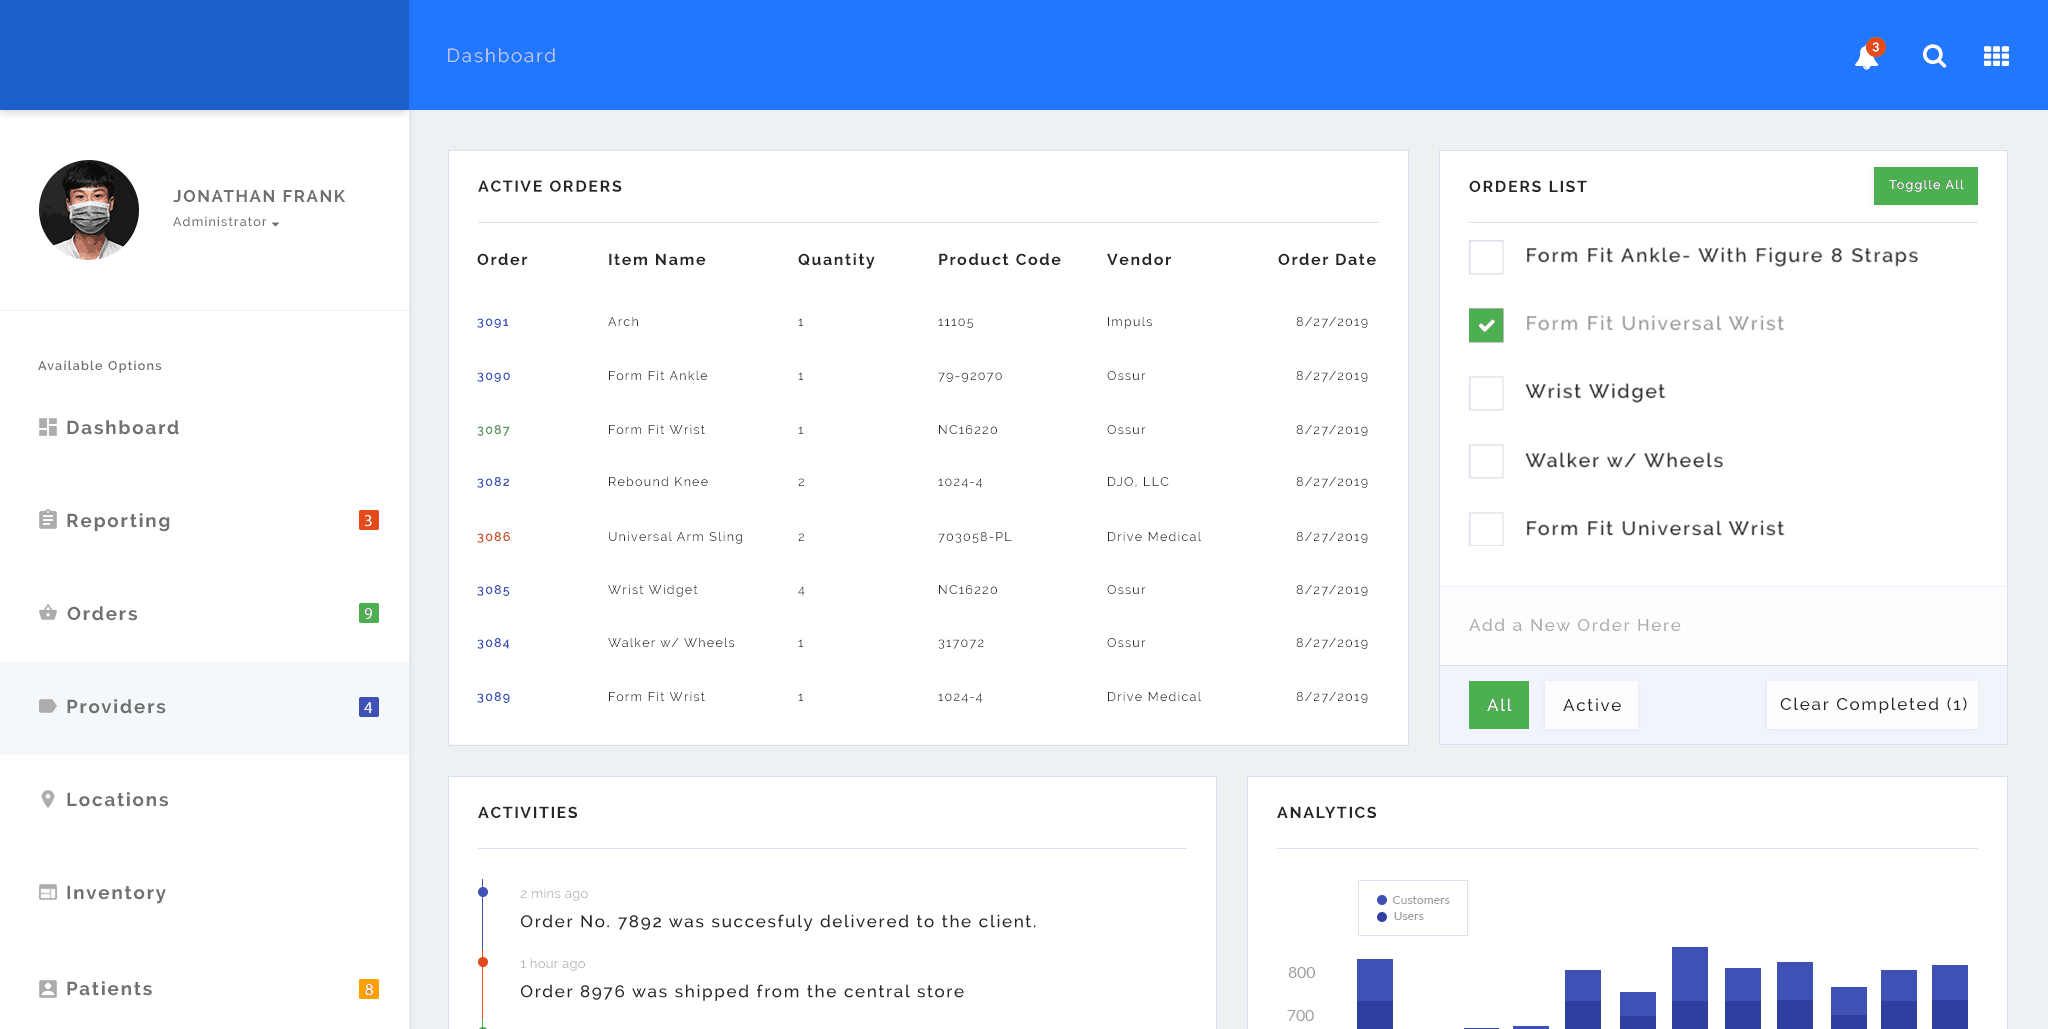
What if you had your web app from the previous example list all medical items sold during last month sorted by volume? Well, that would be a report, wouldn’t it? So a report is a detailed (often textual) representation of a massive data set.
Visuals vs. Text
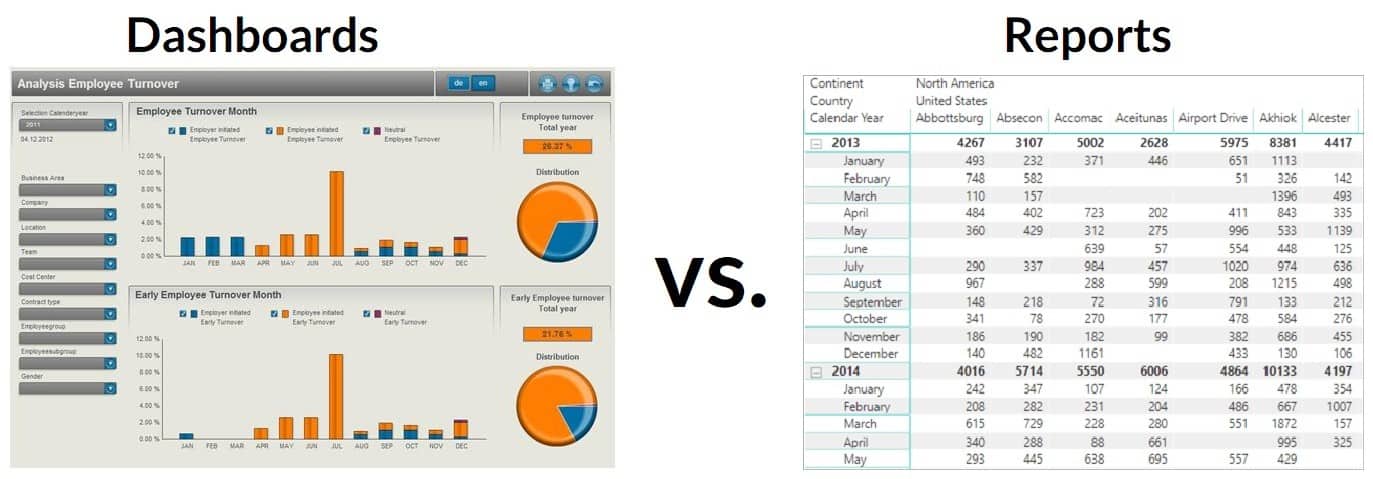
If you noticed, we’ve already set dashboards and reports apart in their definitions using this very criterion. A data console conveys data through graphics: charts, graphs, plots, etc. And reports most often come in the form of tables where information is communicated textually.
 Conciseness vs. Longevity
 Conciseness vs. Longevity
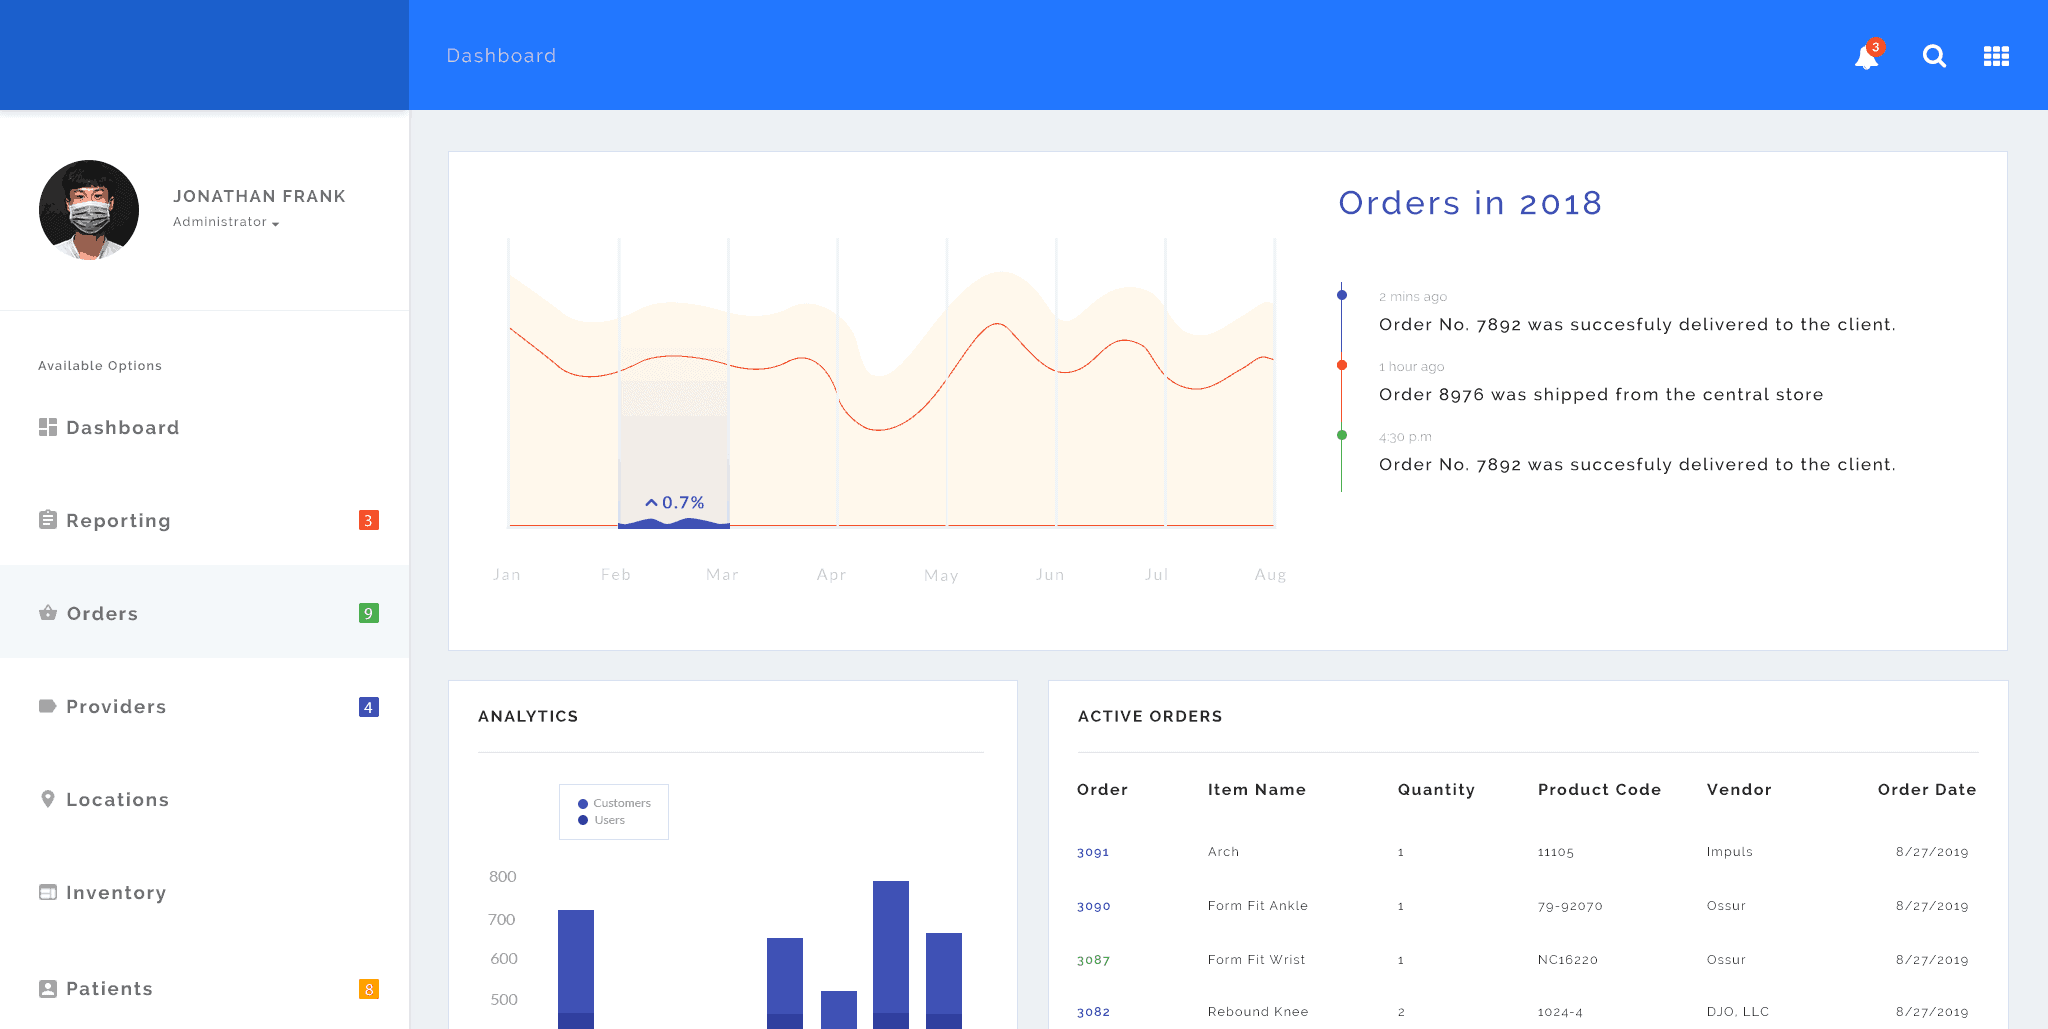
Reports are long, and dashboards are concise. The gurus of dashboarding, e.g., Stephen Few stress that an effective dashboard fits within a single screen:
“My insistence that a dashboard should confine its display to a single screen with no need for scrolling or switching among multiple screens, might seem arbitrary and a bit finicky, but it is based on solid and practical rationale.”
Stephen Few, Information Dashboard Design
That seems to lie on the surface indeed: Reports need to provide the underlying data in its completeness to allow users to analyze the trends, and dashboards focus on a few KPI that are critical to a certain aspect of a company’s operations.
Related: App Metrics to track
CEO vs. Employees
The target audience for visualization panels and reports is going to differ slightly too. While both are often designed for the C suite’s convenience, dashboards are predominantly used by higher-ranking managers like CEOs. Reports are used by virtually everyone: from the middle ranks to vice presidents of a company.
In other words, dashboards help business leaders make insightful decisions, and reports supply the data for the insights.
Dynamic vs. Static
Some argue that a dashboard usually displays dynamic content that can change in real-time, and that reports just bear static data.
 That’s not entirely true as modern web apps allow you to have both static and dynamic reports. Nevertheless, the purpose of reports is to provide a snapshot of data for some period, and data consoles focus on real-time data.
Reasons You Need a Dashboard Web Application
I still remember a discussion with one of our clients explaining his reasoning for including a data visualization in a web application: “Cause everybody loooves dashboards, don’t they?” And you know, it’s hard to argue.
“There is magic in graphs. The profile of a curve reveals in a flash a whole situation — the life history of an epidemic, a panic, or an era of prosperity. The curve informs the mind, awakens the imagination, convinces.”
Henry D. Hubbard, modernized Mendeleev’s periodic table
Dashboards are often eye-candy and sometimes provide the only outlet for users’ strained eyes. However, let’s look at the business goals you may be going after when you plan to build a dashboard website.
Empower employees
First of all, a perfectly designed and implemented data visualization panel can make your team members more productive. They can start their day by assessing the areas that need their utmost attention and drill down into the details. With a web data console, your employees:
- work with the same critical data points across different teams
- easily access the essential information
- onboard and engage with the company’s operations faster
Inform management
Designing a web dashboard helps the company’s management reach vital decisions faster and keep tabs on what’s happening in the company overall. Are there specific KPIs that need closer attention? Are we still on target to hit the yearly goals? CEOs, vice presidents, and other decision-makers find consolation in having at-a-glance access to critical company data: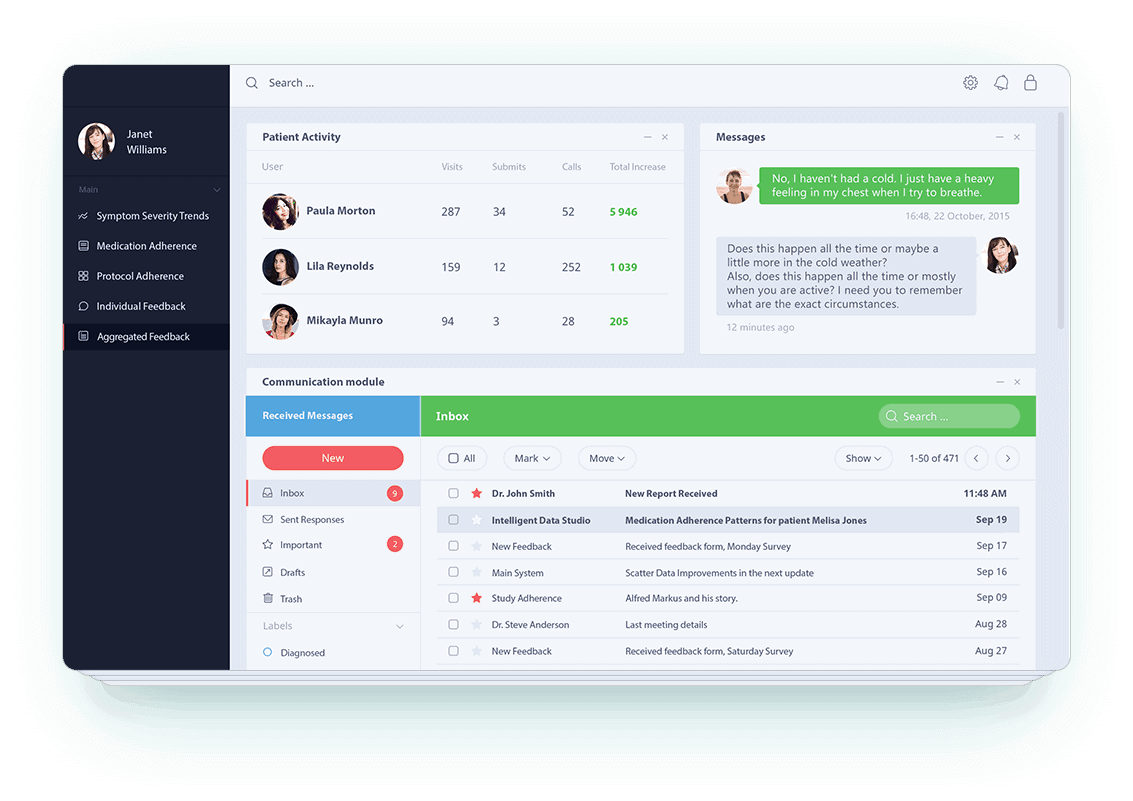
- access at-a-glance company well-being assessment
- quickly assess risks and progress
- share a snapshot of business data securely
Also Related: The Complete Guide to Building a Hospital Management Software
Out-of-the-box Solutions vs. Custom Development
If you want to create a dashboard web application, it’s worth knowing the alternatives. In the case of a dashboard for your website, you are free to choose from ready-made solutions. Of course, such out-of-the-box products will have some advantages and disadvantages over a custom web data panel. Let’s see which variant works best for your business.
Pros and cons of ready-made solutions
An off-the-shelf dashboard on website can save you the time and money you’d have to spend to develop a dashboard application from scratch. What usually happens with ready-made solutions is that businesses pick an enterprise package that’s tailored to their business needs and roll with it.
For example, a real estate firm may look for real estate analytics software that comes with dashboards. Once they find a fitting solution, all they need to do is populate it with actual data.
 Another approach is to utilize a builder that allows the company to build its own web data console using existing templates. What these ready-made products miss is flexibility with plugging into any database or API to receive the data for visualization.
Pros:
|
Cons:
|
Pros and cons of custom-built dashboards
Obviously, you have way more control with custom dashboards. You can tweak them into any imaginable shape and color, pull from any data sources, and protect the data with advanced security best practices, e.g., user role restrictions.
But such customization comes at a cost: It takes longer to develop and deploy custom-built data boards; plus, it normally requires a more significant upfront investment compared to ready-made web dashboarding solutions.
Pros:
|
Cons:
|
Talk to an expert to decide the right approach for you
Top 3 Out-of-the-Box and SaaS Dashboarding Solutions
Google Data Studio
Google Data Studio is a free dashboarding application that data analysts and business users can use with the same efficiency. The product seamlessly integrates with Google marketing and consumer products, e.g., Google Analytics or YouTube, and also works with databases (BigQuery, MySQL, and PostgreSQL), CSV files, and social media platform.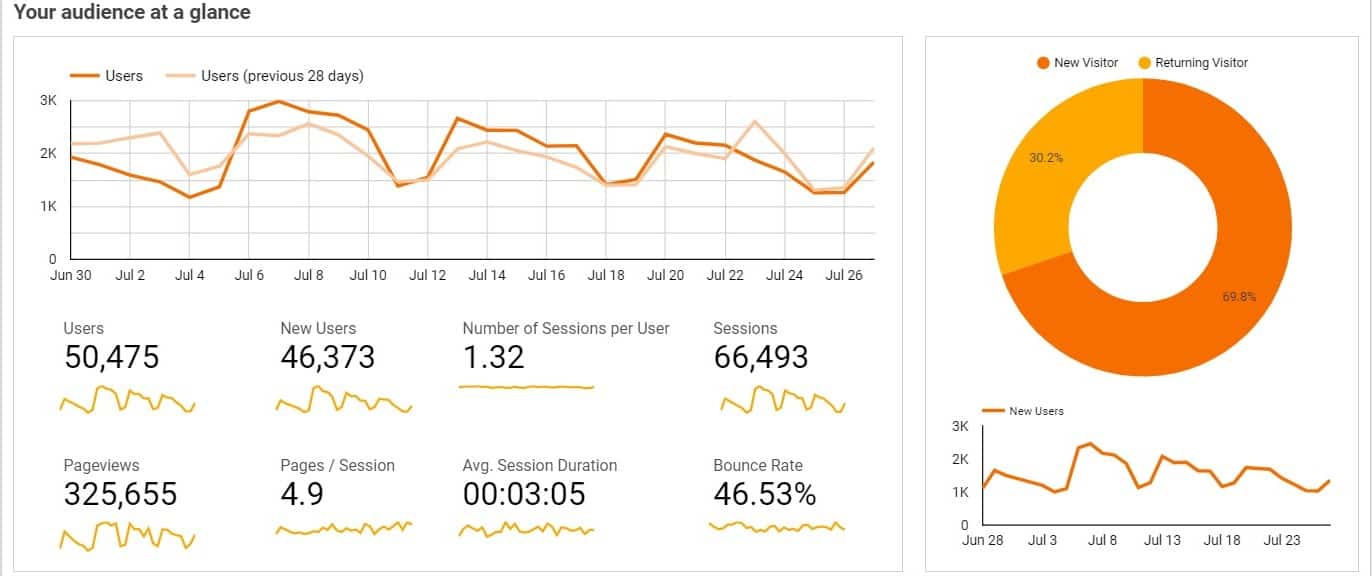
- built-in sample reports
- custom design and style controls
- rich library of visualizations
Sisense
Sisense focuses on streamlining visualization of complex business data. This dashboarding SaaS solution removes the need for data preparation and provides all necessary instruments to visualize and analyze massive data sets without requiring assistance from IT staff. Sisense works decently on rather old computers and doesn’t need a special data warehousing setup.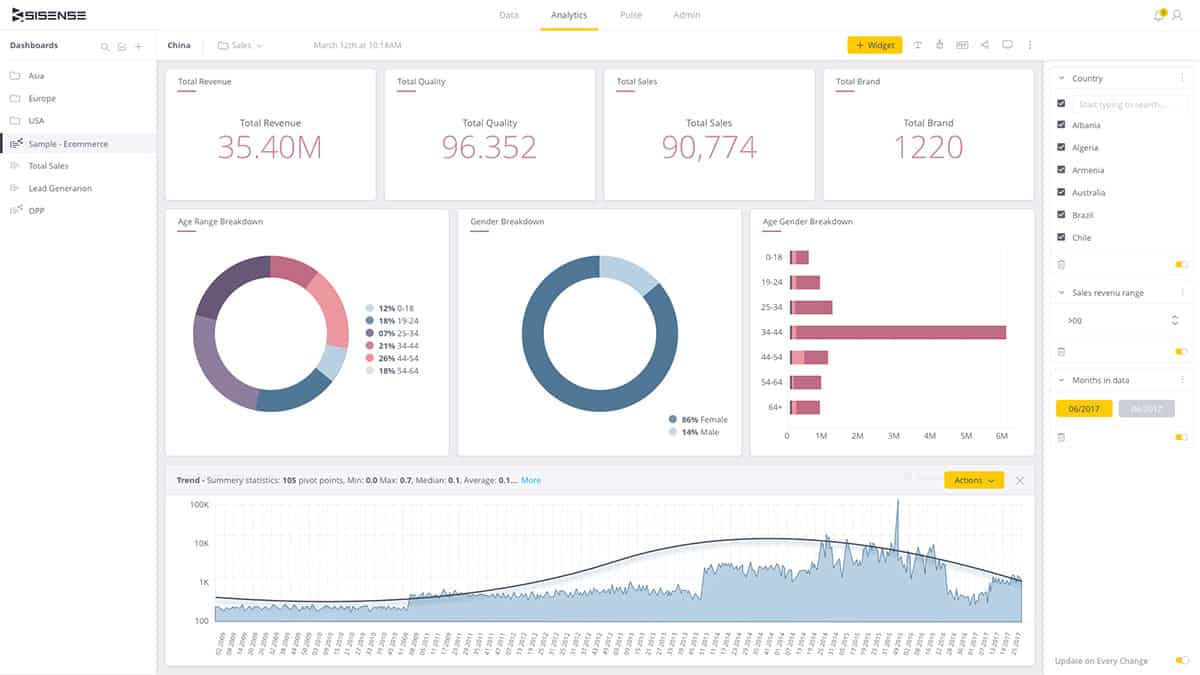
- real-time data querying
- IoT, ML, and AI prebuilt components
- works with multiple, disparate data sources
QlikView
Qlik Sense is one of the leading business intelligence platforms that simplifies work with multiple complex data sources to provide users with a glimpse of actionable insights. The product allows searching across all data, supports interaction with dynamic apps, panels, and analytics suites.
- capturing data for analysis from mobile devices
- real-time collaboration
- state-of-the-art visualizations
How to Make a Dashboard Website?
Dashboard web application development may sound like a trite undertaking, but it’s actually an intricate business if you want your employees to really embrace the app. Here are the steps you can take to create a dashboard app.
Step 1: Find a product-market fit
As the first step, we suggest you research the target audience for your website with dashboard. You have to narrow down their needs and pain points to understand how the dashboard web app can help them operate their business more efficiently.
The best scenario to uncover this information is to run user surveys, watch test users working with existing tools, and conduct face-to-face interviews. The data you’ll gather will guide the feature set of your web dashboard solution. However, before developing the dashboard, you’d want to build a rapid prototype, which is the next step we recommend.
Step 2: Design
All data you collect at the first step ensures you design a website dashboard for a specific group of users. And the design in developing such a solution is everything. So knowing what data points users need to visualize definitely helps.
 Like with any other software project, you begin to develop a web dashboard with creating rough wireframes that are relatively easy to modify based on the user feedback. The wireframes are used to build a clickable prototype that’s refined using tools like usertesting.com. That’s also the stepping stone for transitioning into the high-fidelity design.
Related: The Only UI/UX Guidelines You Need to Design a Winning App
Step 3: Review available tools to speed up development
Going out of the second phase, you’ll have an interactive prototype of the dashboard optimized according to your target audience preferences, which literally urges you to start development. However, we recommend spending time researching available toolsets that can spearhead the development of your web dashboard.
Ready-made SDKs and APIs
If you choose to build a web dashboard using an existing platform like Looker, check their documentation to see if it provides all necessary features, SDKs, APIs, and libraries. For instance, Looker lets you work with three SDKs prepared for different programming languages.
JavaScript charting libraries
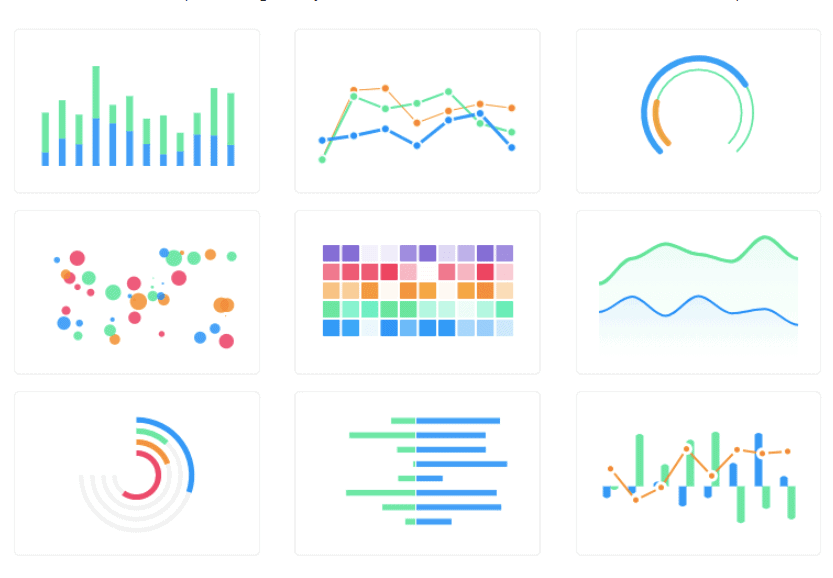
JavaScript has been a favored tool for building all sorts of charts. As a result, there are many proprietary and open-source libraries that provide a shortcut to custom-built visualization apps. Here are a few examples of the libraries that allow creating dashboard layouts:
- Gridster.js
- jQuery Gridly
- Packery
- Dazzle
Third-party integrations
Whatever libraries, SDKs, or APIs you choose to create a dashboard website, review their integration capabilities. How well do they work with your data sources and external tools like Tableau?
Step 4: QA
Once you have developed a dashboard, it’s time to verify it with real users in a production (read customer-ready) environment. Besides checking all features are working as intended, you should also run stress testing to identify how many users the solution can handle.
Remember to run regression tests to ensure all features that you’ve tested during development continue functioning seamlessly. And finally, spend some time on unit testing, especially if your web dashboard spans beyond desktop browsers and supports mobile devices.
Related: QA Guidelines: Steps, Costs, Best Practices
Step 5: Deploy and Maintain
The final step as with any custom developed mobile or web application is to deploy the dashboarding solution to a production environment, remove all test data, and set up a backup mechanism and an uptime monitor to make sure your product remains accessible to users at all times.
 After that, it’s just a matter of maintenance updates to make sure you’re using the most up-to-date versions of the tools in the app architecture. That’s critical for the dashboard app to remain secure.
What are you waiting for? Schedule a 30 minute consultation
How Much Does It Cost to Create Your Own Web Dashboard?
The cost of developing an app will largely depend on your project’s scale: If it’s a personal website dashboard, your budget may well fit within $16,000. However, if you’re looking to build an enterprise-grade solution, the price may soar to $60,000-80,000.
Remember that if you are making a web dashboard for healthcare, you might need to make the solution HIPAA compliant. That automatically raises the development budget by another 80 hours / $8,000.
Another good practice for lowering the development costs of a dashboard app is to choose ready-made components. For instance, we used the Charts library and a React Native wrapper called react-native-charts-wrapper to seamlessly implement data panels in a cross-platform mobile app.
Read Also: React Native or Swift: Which To Choose For iOS?
Our Experience in Dashboard Web Application Development
At Topflight, we build applications that help companies in the healthcare and fintech sectors remain at the top of their game. To enable that, an app needs to surface the company’s most vital data and bring it to the front in the most efficient way. Therefore, a dashboard is often a welcome addition in web and mobile apps we develop.
Here are some of the most exciting dashboards we’ve built for our clients.
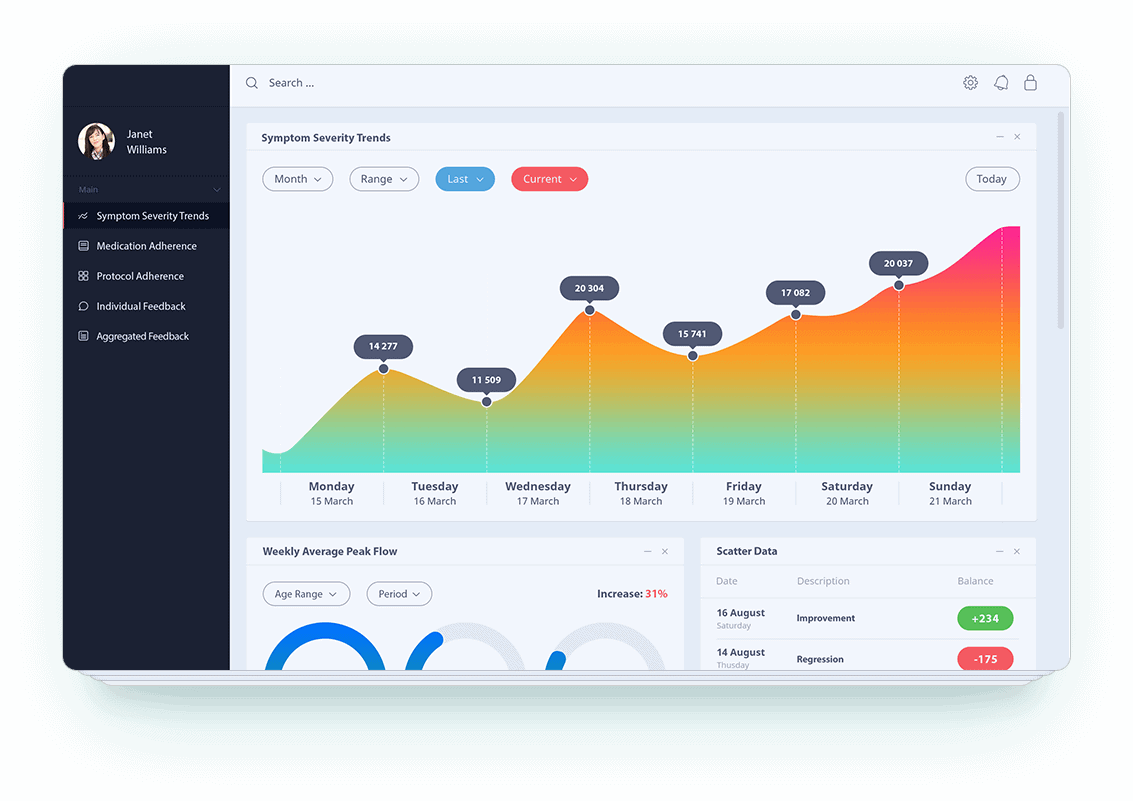
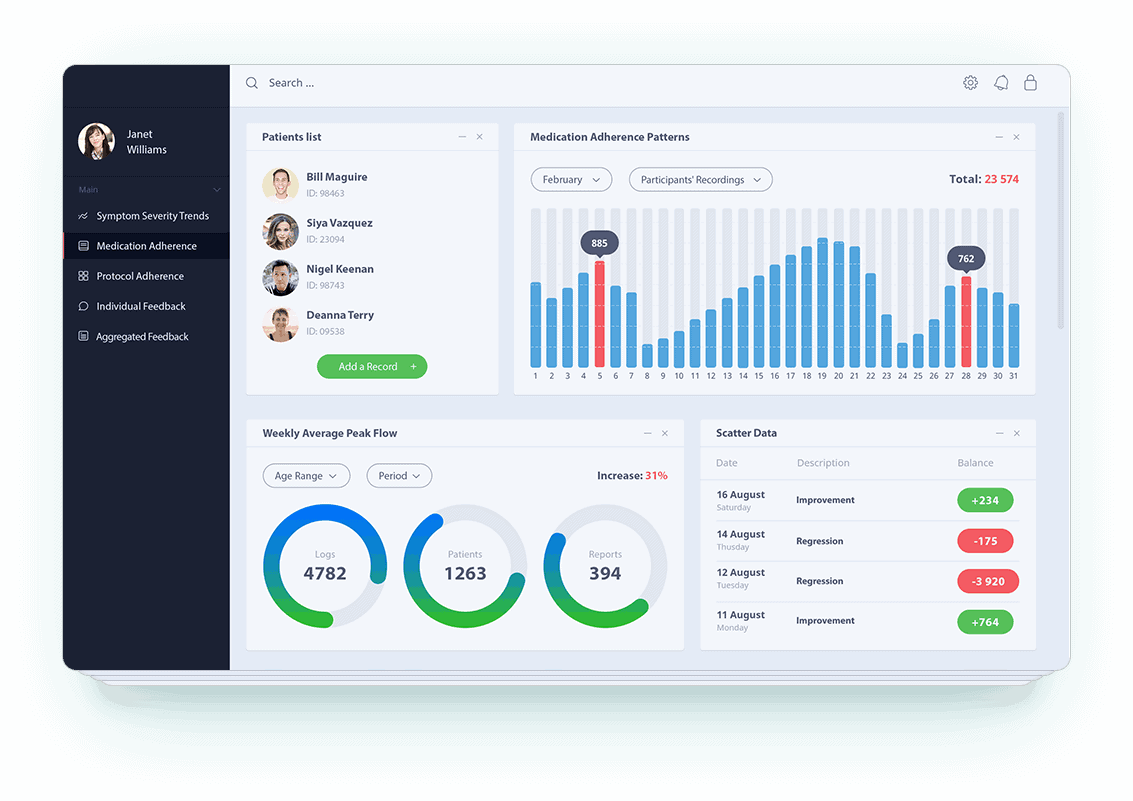
You & M.E. registry for the ME/CFS community
We built the entire platform that connects ME/CFS patients with researchers, relying on data visualization. The registry consists of web applications for patients, Solve M.E. employees, and researchers — each featuring a different set of visualizations, and a mobile app for patients that includes several dashboards for displaying patient health data.
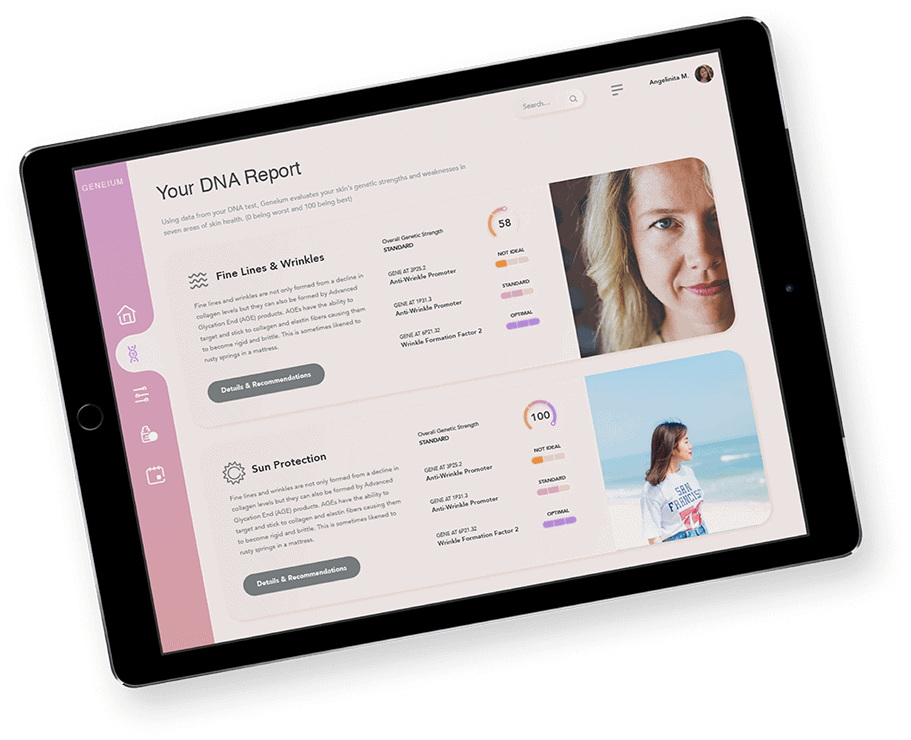
Genium — teledermatology platform
Genium is a dermatology platform accessible from mobile and desktop browsers. The app features engaging dashboards that help customers to better understand and take care of their skin, based on its DNA interpretation. Read the case study here.
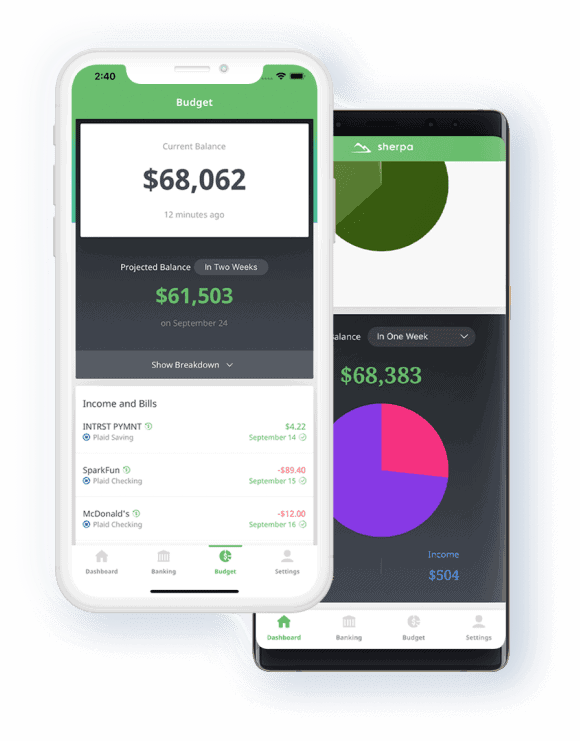
Sherpa — fintech application
Sherpa is a smart-budgeting app that connects to users’ bank accounts, analyzes their spending habits, calculates future budgets, and offers professional advice to help users control their finances. An essential part of the project was a visualization of users’ budgets, spending habits, and projection of their personal financial trends. Read the case study here.
Related: Fintech App Development Services
Medical dashboard
We worked with a Fortune 100 pharmaceutical company to design and develop a dashboard to visualize and analyze the results of a remote clinical trial study.
“A dashboard needs to be light, focus on “K” in KPIs.”
Pearl Zhu, the author of “Digital Master” book series (25 books)
It’s Time to Create a Web Dashboard
Now you have everything you need to start building engaging, profit-turning web dashboards. If you are still uncertain about some aspects of this challenging task, like picking the most appropriate tech stack, app monetization strategies, how long it app development will take or updating an existing dashboard on your website, our team is here to help you. We’re app developers in Miami, NYC, Los Angeles, reach out for a free consultation, and we’ll help you design, verify, develop, and deploy a beautiful and practical dashboard.
Frequently Asked Questions
How long does it take to build a dashboard web application?
Depending on the project scale from 3 weeks to a couple months.
How much does it cost to develop a dashboard?
Depending on the project scale, between $20,000 (for a basic, one-user-role app) and 80,000 (for a full-fledged enterprise solution).
Can I use the same technologies to build a dashboard that will work on desktop and mobile?
Yes, React.js is the perfect tool.
What do I start with when creating a web dashboard?
With an interactive prototype that will help you leverage user feedback.
What is the single most important best practice for designing a useful dashboard?
The visual representation of data should fit into one web page without asking users to scroll.
Do I have to develop a dashboard from scratch to accommodate my company’s specific needs?
No, there’s plenty of third-party SaaS solutions that provide enough customization options to suit most cases.
How do I measure my dashboard app’s effectiveness?
It’s the ratio of the time users spend reviewing the console to the number of sensible, long-term oriented business decisions.